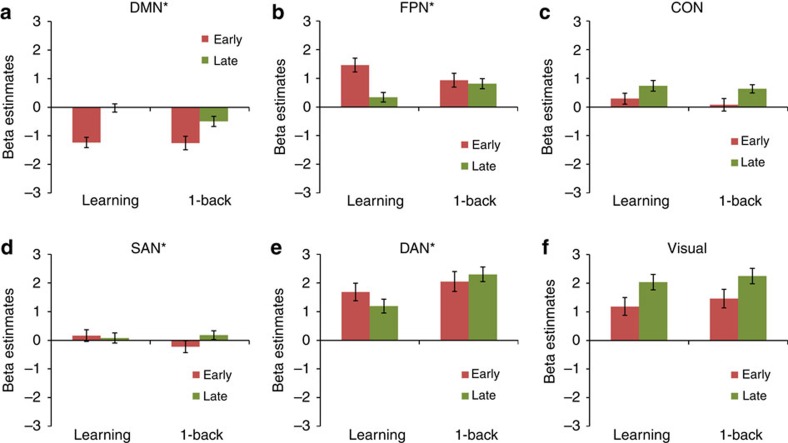
Figure 2. Mean activations for 6 of the 10 networks for early and late practice and for the learning and control sample respectively.
(a–f) Asterisk indicates a significant difference between the learning sample (N=70) and the control sample (N=67) in terms of activation changes from early to late practice, that is, a two-sided two-sample t-test (learning (late–early) versus control (late–early)) was significant (P<0.05) after Bonferroni correction for 10 tests. Black lines represent 95% confidence intervals. Activations of the four remaining networks can be found in Supplementary Fig. 2. P values and t-values for all 10 tests can be found in Supplementary Table 1. CON, cingulo-opercular network; DAN, dorsal attention network; DMN, default mode network; FPN, fronto-parietal network; SAN, salience network.

