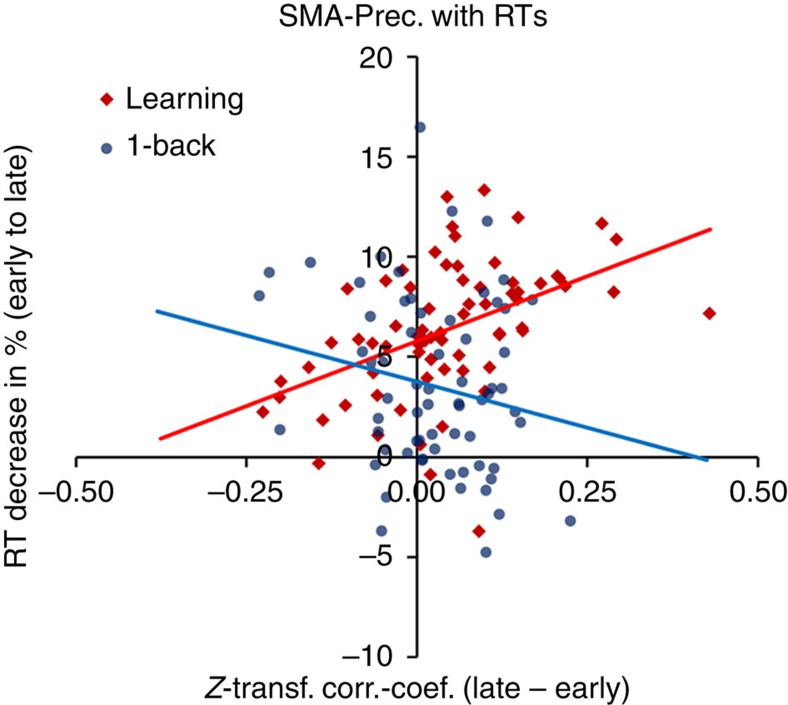
Figure 6. Correlation of connectivity change with response time (RT) decrease.
The plot shows connectivity change between a node of the CON (within the SMA) and a node of the DAN (within the precuneus) on the x-axis and percentage of RT decrease on the y-axis. For the learning task, a higher increase in connectivity predicted a larger decrease in RTs during practice (Pearson r=0.47, z=4.2, Bonferroni-corrected P=0.004). The difference between the learning sample (N=70) and the control sample (N=67) was also significant (z=4.1, Bonferroni-corrected P=0.008). No significant correlation was found for the control sample (r=−0.20, z=−1.6, uncorrected P=0.11). Data points represent values of individual subjects. For activation and connectivity results for the two nodes, see Supplementary Fig. 5. RT, response time; SMA, supplementary motor area; Prec., precuneus; CON, cingulo-opercular network; DAN, dorsal attention network.

