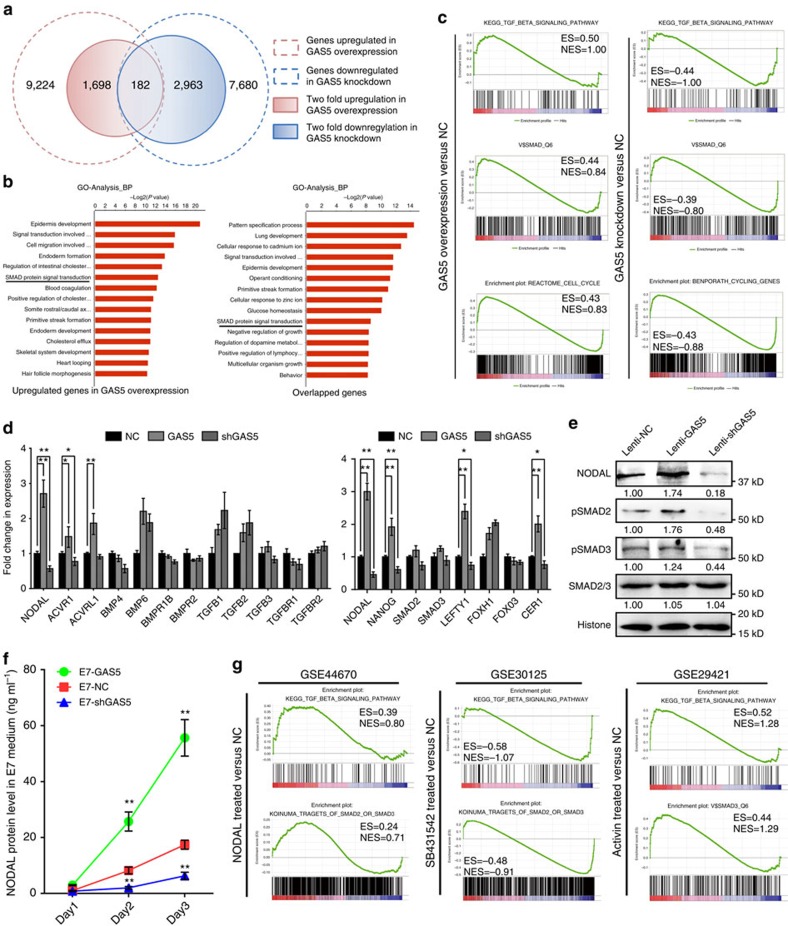
Figure 3. Global mRNA analysis revealed NODAL–SMAD signalling is controlled by GAS5.
(a) High-throughput RNA sequencing of GAS5 stably overexpressed or knockdown hESCs. The graph depicts the number of GAS5 co-expressed genes generated from the sequencing. (b) Gene ontology analysis of the differentially expressed genes. The left panel used 1,698 genes with twofold up regulation in expression and the right panel used 182 genes in the intersection part in a. (c) Gene set enrichment analysis of gene signatures (GSEA) in GAS5 overexpressed hESCs versus control group, and GAS5 knockdown hESCs versus control group. ES represents enrichment score and NES represents normalized enrichment score in each category. Higher score represents higher possibility that the treatment has positive effect on such gene category. (d) qPCR analysis of key genes and receptors in the TGFβ families in GAS5 overexpressed or knockdown hESCs (left panel). The right panel shows qPCR analysis of genes involved in the NODAL signalling in GAS5 overexpressed or knockdown hESCs. *P<0.05, **P<0.01, t-test, n=3. (e) Western blot (n=3) showing changes of NODAL, SMAD2/3 and p-SMAD2/3 in GAS5 overexpressed or knockdown hESCs. (f) ELISA analysis of NODAL in the indicated cell culture supernatant. E7 is a chemical defined and serum-free culture medium used for analysing the net NODAL production of hESCs that influenced by GAS5 overexpression or knockdown. The ingredient of E7 medium does not contain TGFβ, NODAL nor Activin. **P<0.01, t-test, n=3. (g) GSEA gene signatures of microarray or high-throughput sequencing data that involve the activation or inhibition of NODAL or Activin signaling. SB431542, an ALK4/7 inhibitor. Error bars represent s.d. of the indicated experiment replicates. RNA level of β-actin served as internal reference for qPCR. See also Supplementary Fig. 3.

