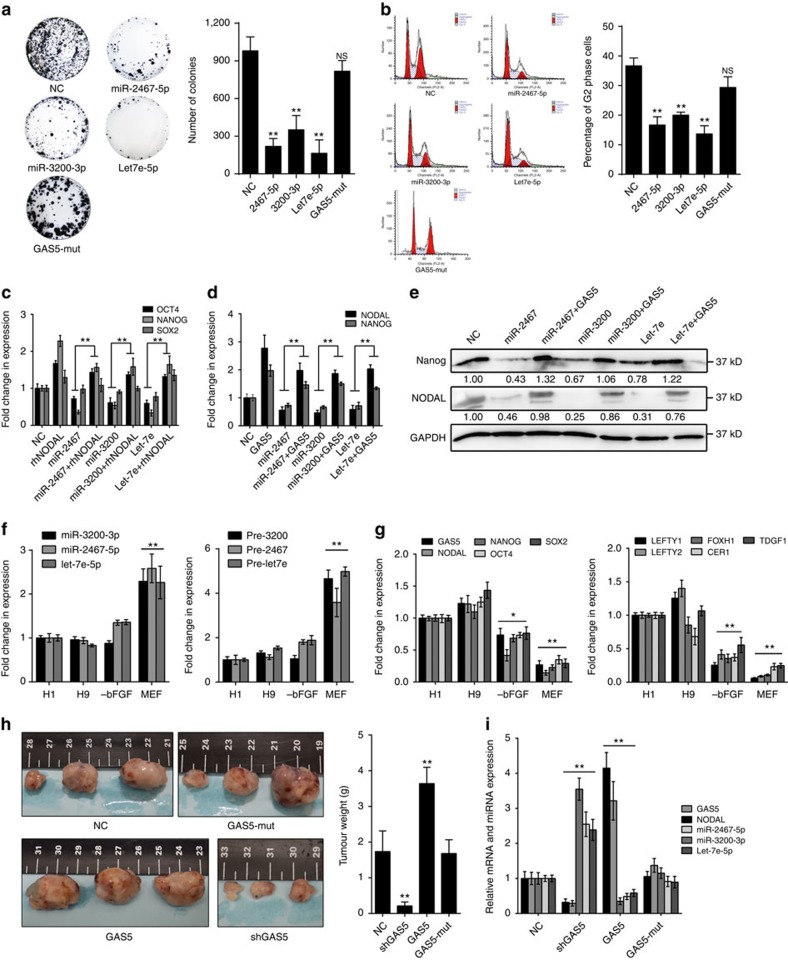
Figure 7. MiR-2467/3200/Let7e inhibit self-renewal and attenuate GAS5-mediated NODAL signalling in hESCs.
(a) Colony formation assay with different miRNA transfection in hESCs. Quantification of colonies are shown in the right panel. NS, not significant; NC, microRNA mimic control overexpression group. **P<0.01, t-test, n=3. (b) Cell cycle analysis of different miRNA overexpression in hESCs. Comparison of cell ratios in G2 phase are shown in the right panel. NS, not significant; NC, microRNA mimic control overexpression group. **P<0.01, t-test, n=3. (c–e) The mRNA level of pluripotency genes in miRNA-transfected cells combined with rhNODAL incorporation (c) or GAS5 overexpression (d). The relative western blot results are shown in the right panel (e). NC, microRNA mimic control overexpression group. **P<0.01, t-test, n=3. (f) Analysis of mature microRNA and pre-miRNA expressions between different differentiation methods in H1 hESCs. **P<0.01, t-test t, n=3. (g) The analysis of expression changes of pluripotency genes and NODAL signalling-related genes during different differentiation of H1 hESCs. *P<0.01, **P<0.01, t-test, n=3. Here, −bFGF represents bFGF-deprived hESC medium; MEF represents mouse embryonic fibroblasts culture medium (which contains fetal bovine serum). (h) Teratoma formation assay using lentiviral stably transfected hESCs injected into the back cutaneous of NOD/SCID mice. Six weeks after the injection, tumours were dissected, photographed (left panel) and weighed (right panel). The ruler scales are 0.5 mm per minor mark. **P<0.01, t-test, n=3. (i) Levels of GAS5, NODAL, miR-2467, miR-3200 and Let7e in the tumours were evaluated using qPCR. **P<0.01, t-test, n=3. Error bars represent s.d. of the indicated experiment replicates. RNA level of β-actin served as internal reference for qPCR. See also Supplementary Fig. 7.

