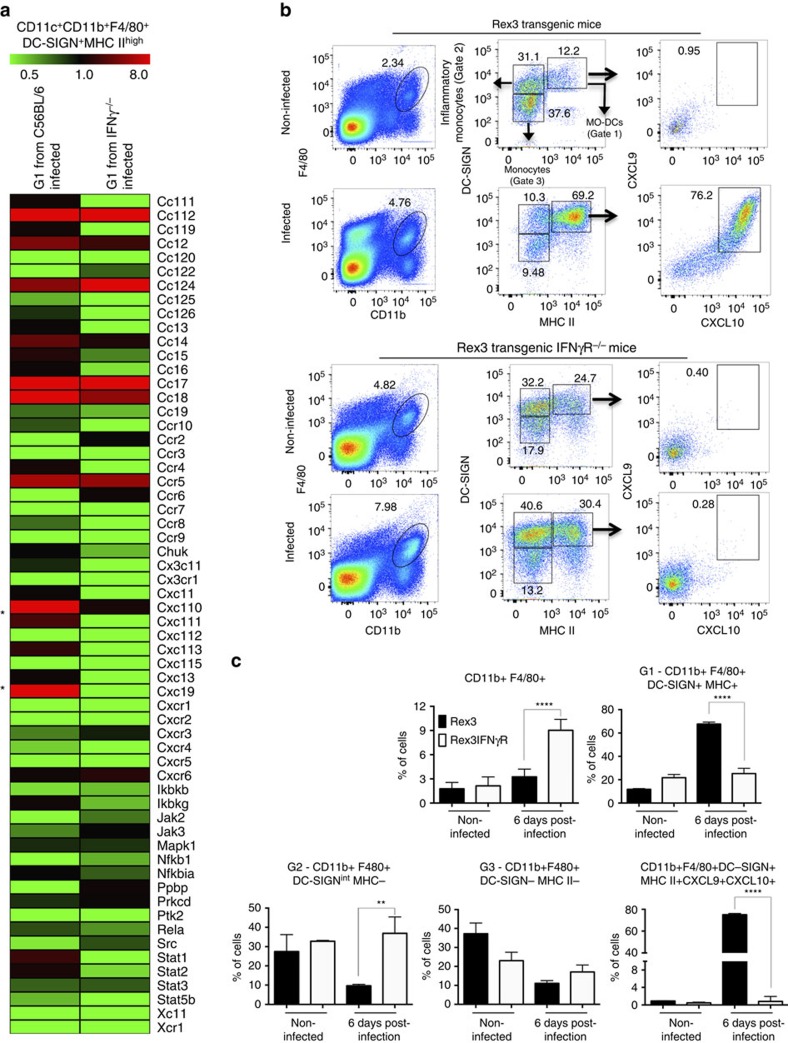
Figure 5. IFNγ-dependent expression of CXCL9 and CXCL10 by MO-DCs from PbA-infected mice.
C57BL/6, IFNγ−/−, REX3 or REX3/IFNγR−/− mice were infected with PbA and their spleens harvested at 6 days later. (a) Gene expression was analysed in total RNA extracted from highly purified (over 98% purity) MO-DCs from infected C57BL/6 and IFNγ−/− mice by nCounter Analysis System. Data represent the average of gene expression of three mice per group. (b) Representative primary flow cytometric dot plots are shown for splenic MO-DCs from REX3 and REX3/IFNγR−/− mice gated on F4/80+CD11b+ (left panels), then on DC-SIGNhighMHC IIhigh cells (middle panels), and CXCL9 and CXCL10 double-positive cells (right panels), respectively. The percentage of MO-DC (Gate 1), inflammatory monocytes (Gate 2) and monocytes (Gate 3), and CXCL9+CXCL10+MO-DCs are indicated. (c) Frequency of splenic CD11b+F4/80+ cell subsets in infected REX3 and REX3/IFNγR−/− mice are shown. The average and s.d. are representative of two independent experiments with three or four mice per group. Differences were considered statistically significant when **P<0.01 and ****P<0.0001 as indicated by two-way analysis of variance analysis.

