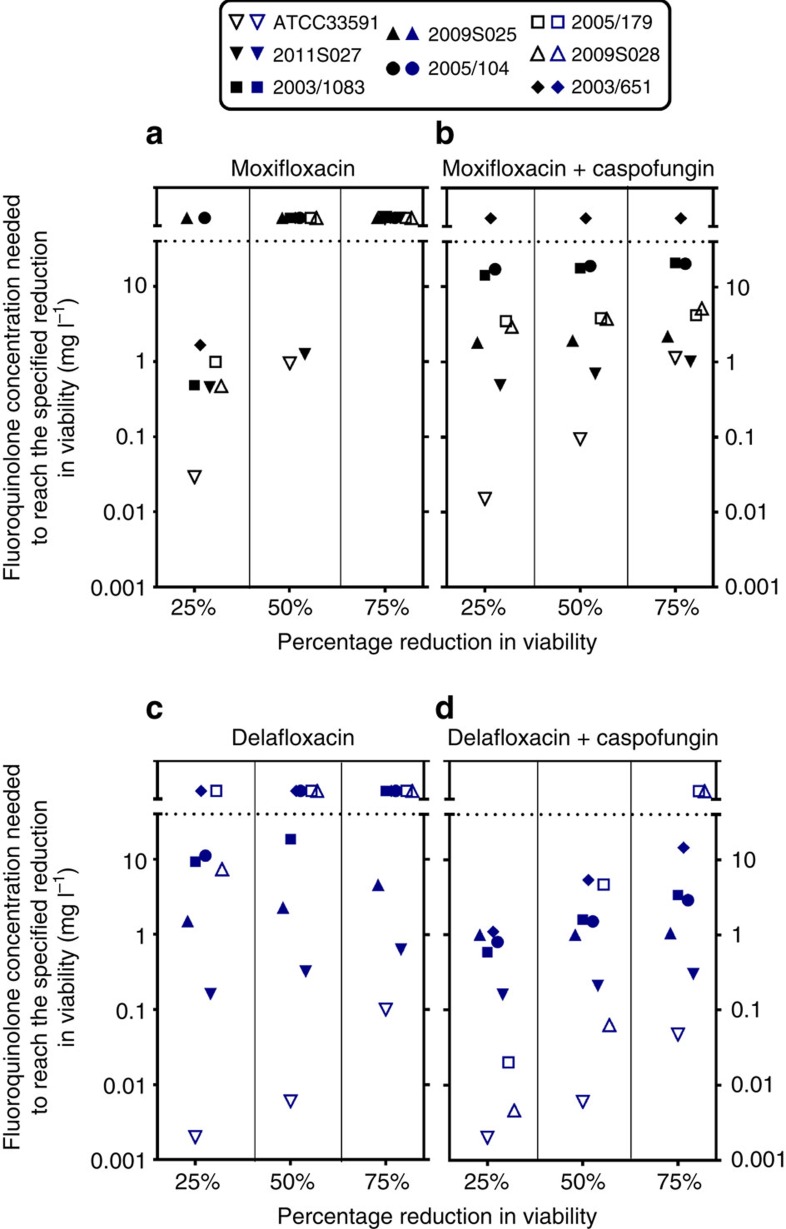
Figure 2. Relative potencies of fluoroquinolones alone or combined with caspofungin on biofilms.
Comparison of relative potencies of fluoroquinolones alone (a moxifloxacin; c delafloxacin) or combined with a fixed concentration (40 mg l−1) of caspofungin (b and d) against biofilms. The ordinate shows the concentrations of fluoroquinolones needed to reach 25, 50 or 75% reductions in viability as assessed by measuring residual resorufin fluorescence. Active concentrations were calculated based on the equation of sigmoid concentration–response curves obtained for each strain in experiments similar to those illustrated in Supplementary Fig. 3. Each symbol corresponds to a specific strain, as indicated on the top of the graphs. A lower active concentrations corresponds to a higher potency. The horizontal dotted lines separate values for which calculated concentrations were above the actual maximal fluoroquinolone concentrations tested (20 mg l−1).

