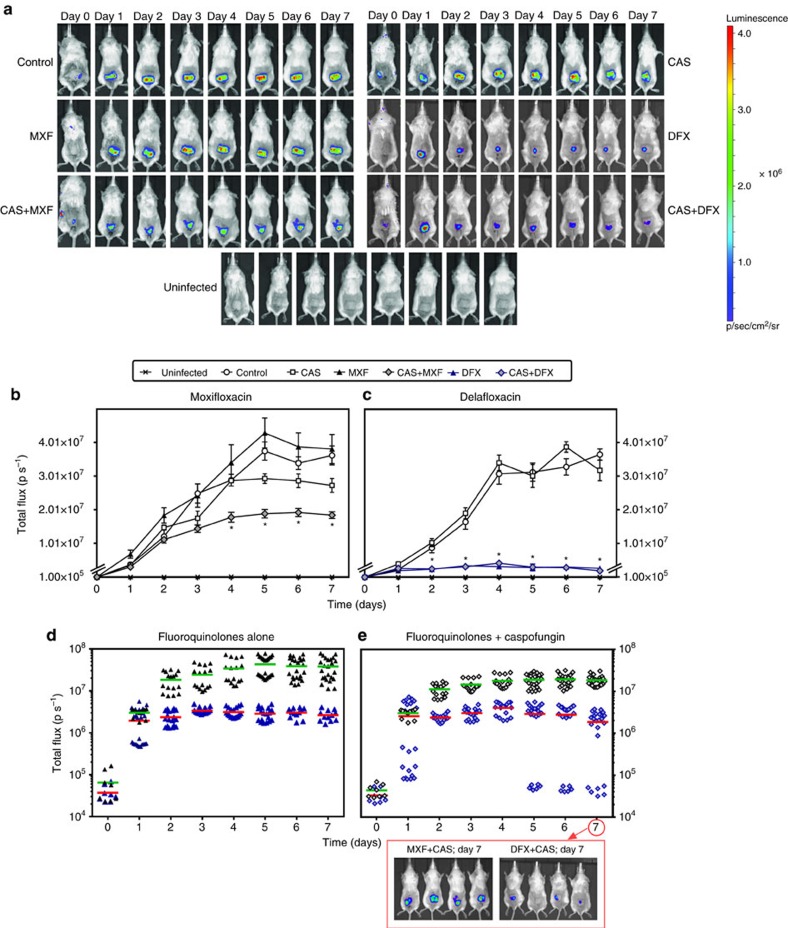
Figure 4. Activity of fluoroquinolones alone or combined with caspofungin against the bioluminescent strain Xen36 in vivo.
Bioluminescent signal emitted from catheters infected by Xen36, implanted at day 0 in the back of mice treated 24 h after implantation and for the next 7 days with caspofungin (CAS) (4 mg kg−1 of body weight once daily), moxifloxacin (MXF) or delafloxacin (DFX) (40 mg kg−1 of body weight twice daily) or with a fluoroquinolone and caspofungin (each injected separately and according to its own schedule; (CAS+MXF) or (CAS+DFX)). All drugs were given by intraperitoneal injection. Control: animals implanted with infected catheters and treated by normal saline (0.9% NaCl) twice daily. Uninfected: animals implanted with non-infected catheters and left untreated (used for detection of background signal). (a) Representative bioluminescence images for one mouse per group: intensity of the transcutaneous photon emission represented as a pseudocolor image. (b,c) Quantitative analysis per fluoroquinolone (moxifloxacin and matching controls (b); delafloxacin and matching controls (c)): in vivo bioluminescence signals expressed in photons per second (p s−1), with data expressed as means±s.e.m. Statistical analysis: two-way ANOVA, Tukey post-hoc test. *P<0.001 when comparing combinations versus fluoroquinolones alone. (d,e) Quantitative analysis comparing both fluoroquinolones when given alone (d) or in combination with caspofungin (e). The data are shown as individual values with the corresponding means represented by a horizontal coloured line. Images are those of four mice treated during 7 days by the combinations.

