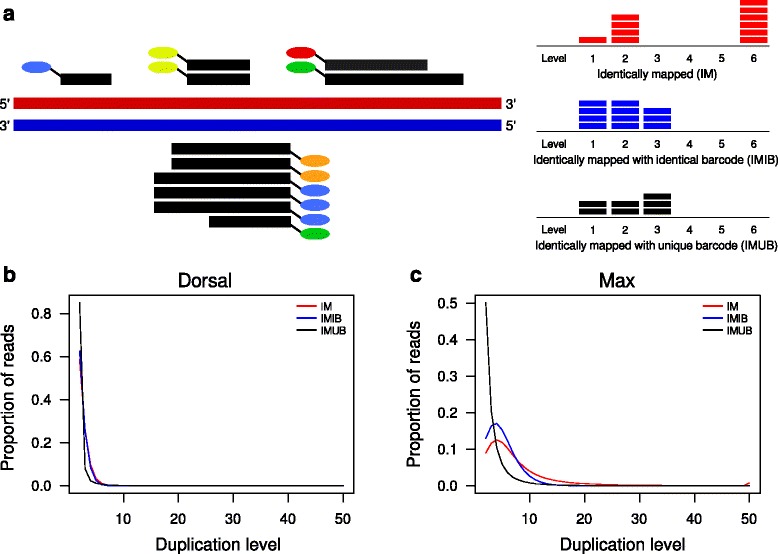
Fig. 2.

Duplication levels using random barcodes. a Toy example of mapped ChIP-nexus reads and the corresponding counts for identically mapped reads (IM, red), identically mapped reads with identical random barcodes (IMIB, blue), and identically mapped reads with unique random barcodes (IMUB, black). The number of horizontal bars for a given level corresponds to the number of reads that have the same level of duplication. Additional file 1: Figure S1 provides a detailed example of how IM, IMIB, and IMUB reads are defined and calculated. b, c Duplication level plots for a Dorsal dataset with an overall duplication level of 54 % and for a Max dataset with an overall duplication level of 95 %
