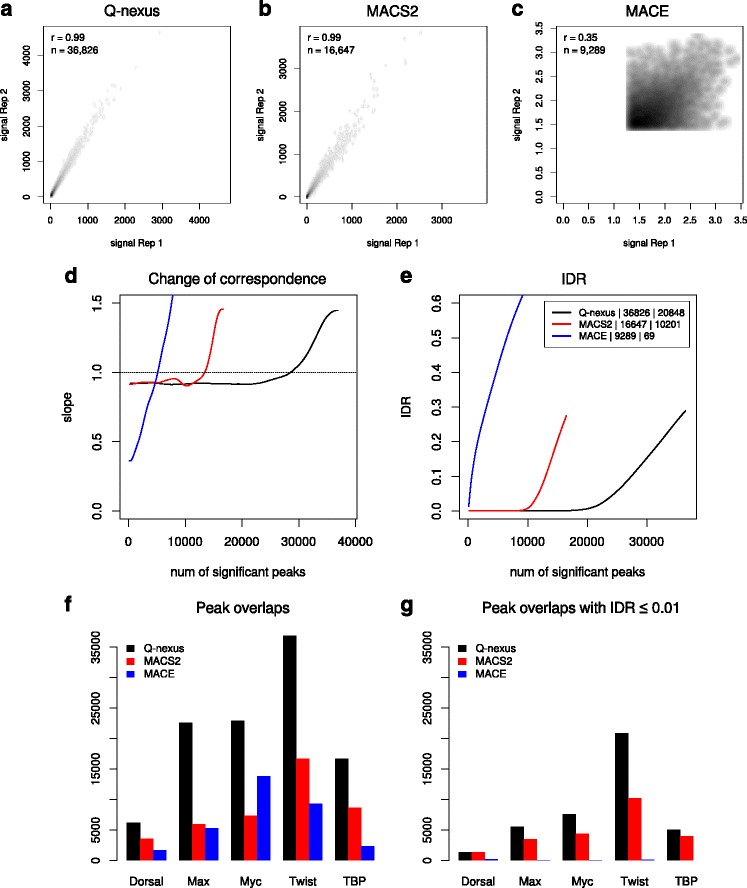
Fig. 6.

Evaluation: Reproducibility of peak calling. a-c We applied the peak calling methods Q-nexus, MACS2, and MACE to a pair of biological replicates of Twist. The scatterplots show the scores of overlapping peaks of the top 100,000 peaks for different methods. The number of overlapping peaks and the Pearson correlation coefficient is given in the upper-left corner of each plot. Q-nexus yields the largest number of overlapping peaks and correlation coefficients of almost 1. d The change of correspondence curve shows that peaks derived by Q-nexus remain consistent for 10,000 more than those of MACS2. e Q-nexus displays a considerably smaller proportion of irreproducible signals (0.01 < IDR) than MACS2. f, g We obtained similar results for the other ChIP-nexus datasets of the transcription factors Dorsal, Max, Myc and TBP. For more detailed results see Additional file1: Figures S7 to S16
