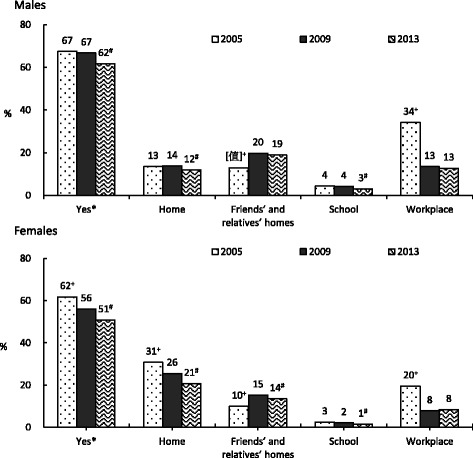
Fig. 3.

Time trend of exposure to secondhand smoke among non-smokers between 2005 and 2013 by gender and age groups. Note 1: * Were those answering yes to the question ‘has been exposed to secondhand smoke last week’. Note 2: + indicates a statistically significant difference between the rate of exposure to secondhand smoke in 2005 compared to 2009 (P < 0.05), # indicates a statistically significant difference between 2009 and 2013 (P < 0.05). Note 3: Comparisons between surveys were adjusted using SUDAAN
