
Fig. 4.
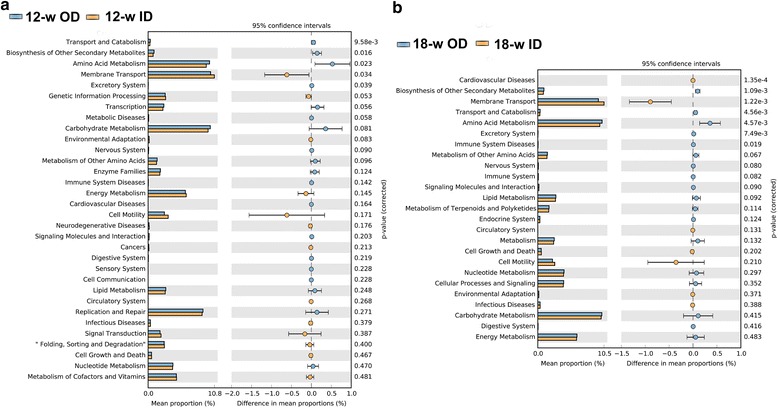
Mean proportion and their differences in predicted functional metagenomes of the cecal microbiota at KEGG level 2. Comparison of functional pathway between microbes of 12-w OD group and 12-w ID group (a), 18-w OD group and 18-w ID group (b)
Official websites use .gov
A
.gov website belongs to an official
government organization in the United States.
Secure .gov websites use HTTPS
A lock (
) or https:// means you've safely
connected to the .gov website. Share sensitive
information only on official, secure websites.
Mean proportion and their differences in predicted functional metagenomes of the cecal microbiota at KEGG level 2. Comparison of functional pathway between microbes of 12-w OD group and 12-w ID group (a), 18-w OD group and 18-w ID group (b)