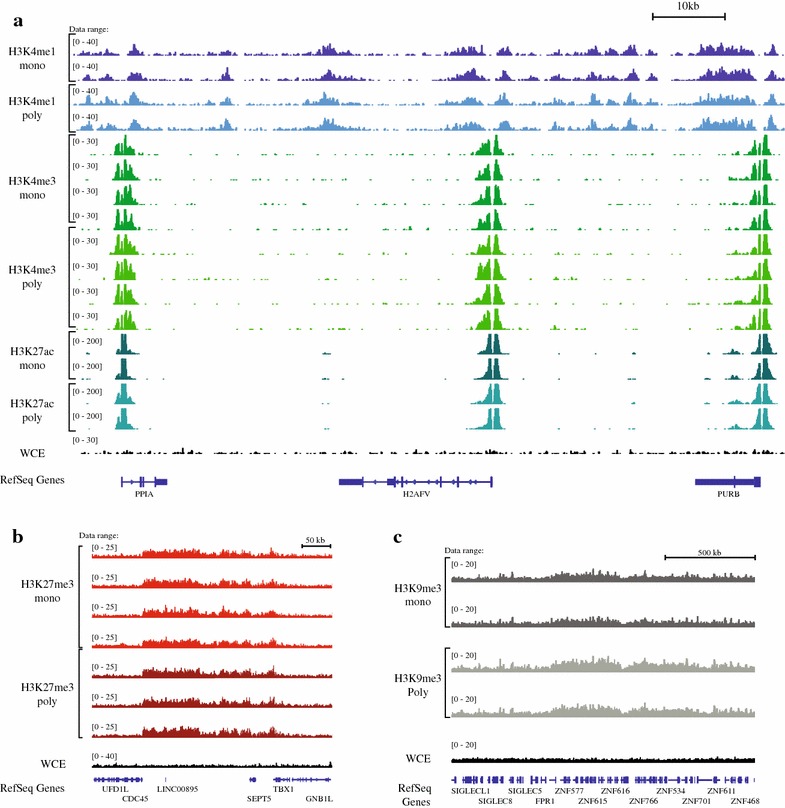
Fig. 1.

Read coverage across the genome. Images of tiled data files (TDFs) generated by the IGV browser [34, 35] displaying the density tracks of reads aligned across the genome. The tracks show the correspondence in read coverage in monoclonal and polyclonal antibodies over representative genomic loci. a Chromosome 7: 44,829,782–44,930,648 (about 100 kb), shows the read coverage of histone modifications associated with “active chromatin” (H3K4me1, H3K4me3 and H3K27ac). The correspondence of read coverage of datasets for two major histone modifications associated with repression: b H3K27me3 [chromosome 22:19,492,023–19,849,594 (about 350 kb)] and c H3K9me3 [chromosome 19: 51,746,058–53,362,194 (about 1.6 Mb)]
