
Fig. 3.
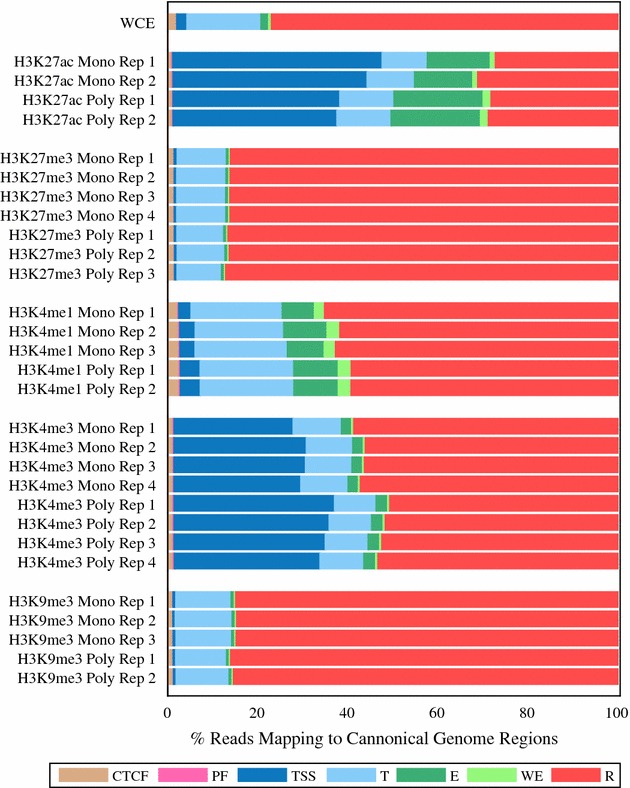
Reads in peaks mapping to canonical chromatin regions of the genome as defined by the ENCODE mappings. This plot displays the percentage of reads that map to each canonical genome region. The canonical genome regions were defined by the combined ENCODE mapping and are abbreviated as follows: CTCF-enriched elements (CTCF), promoter flanking regions (PF), transcription start sites (TSS), transcribed regions (T), enhancers (E), weak enhancers (WE) and repressed regions (R). Only reads that were located at regions identified as peaks were used for this plot. For each peak dataset the reads were normalized by insert size