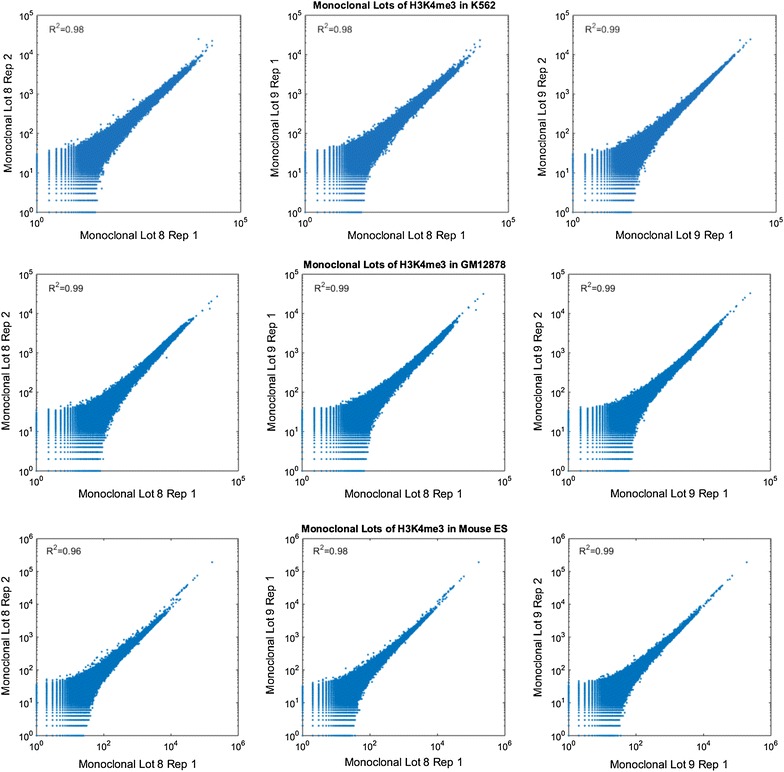
Fig. 6.

Correlation between two monoclonal lots across the genome. Scatter plots (Loglog) presenting counts of reads per bin in non-overlapping 2000-bp windows tiled throughout the genome comparing either technical or lot replicates from ChIP-seq done with H3K4me3 monoclonal antibody in K562, GM12878 and mES
