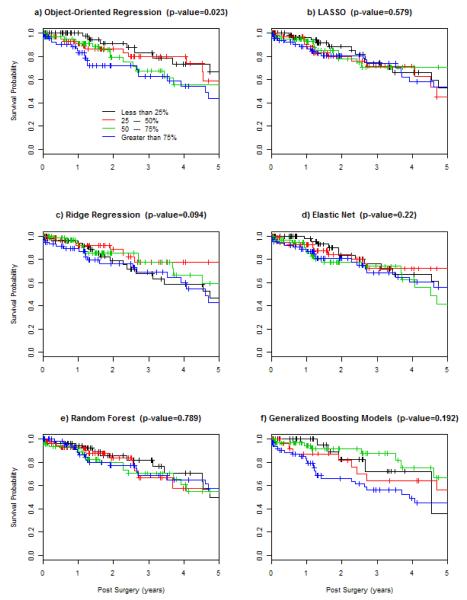
Figure 10.
Computed Kaplan-Meier curves, with the p-value from log rank test, for patients whose predicted values are less than 15%, 25-50%, 50-75%, and greater than 75% percentile, where predicted values are produced by predictive models constructed by six different methods, in the validation data set.

