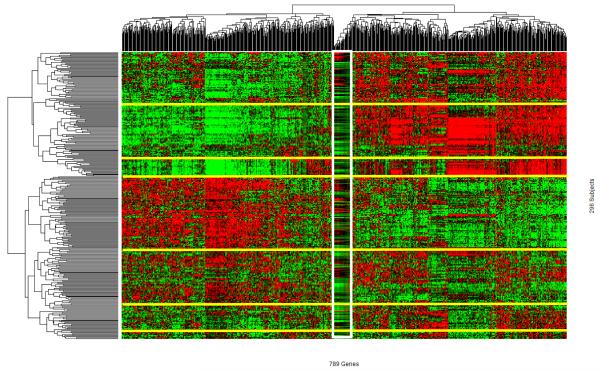
Figure 5.
High dimensional omics data (HDOD) with 789 genes observed among 296 subjects in the training set are organized by two-way hierarchical clustering analysis. Graded green and red colors, respectively, correspond to below and above zero for gene-specific normalized expression values, i.e., lower and higher than averaged expression values, respectively.

