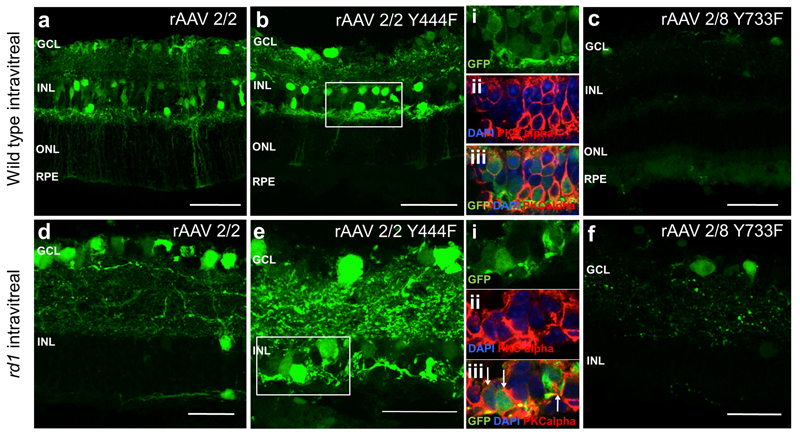
Figure 5.
GFP fluorescence patterns of different rAAV serotypes following intravitreal injection in wild type (WT) C57BL/6 and Pde6brd1/rd1 (rd1) mice. The main images a-f are confocal stacks illustrating overall GFP expression patterns (green). The boxed regions are enlarged and shown as confocal slices in panels bi-iii and ei-iii. Images show GFP expression (green), nuclear labeling (blue) and immunostaining with anti-PKCalpha antibody identifying bipolar cells (red). Colocalisation of red and green signals therefore indicates instances of viral transduction of bipolar cells. GCL= ganglion cell layer, INL= inner nuclear layer, ONL=outer nuclear layer, RPE= retinal pigment epithelium. Scale bar 50 μm for images a-c, 30μm for images d-f.

