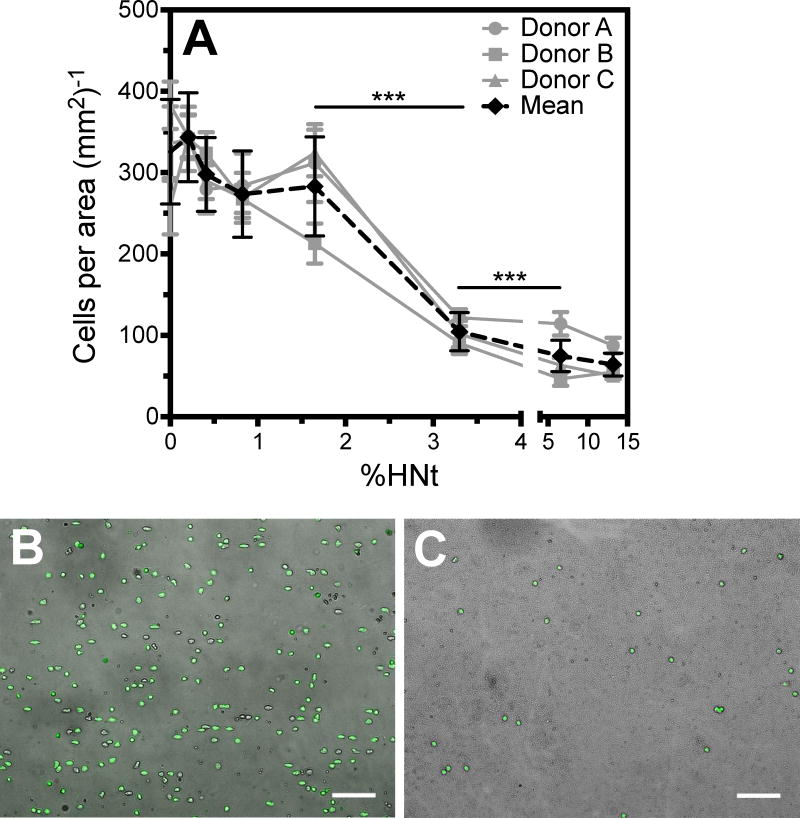
Figure 3.
The number of adherent leukocytes is reduced on high concentrations of HNt (A). X-axis is broken at 5.0%. Representative images demonstrate that there are more leukocytes bound to the smooth surface (B) than to the 13.3% HNt surface (C). Scale bars indicate 100 μm and cells are readily identified by DAPI staining of their nuclei (green). **P<0.01. Error bars represent SEM, however statistical significance was calculated by two-way ANOVA.

