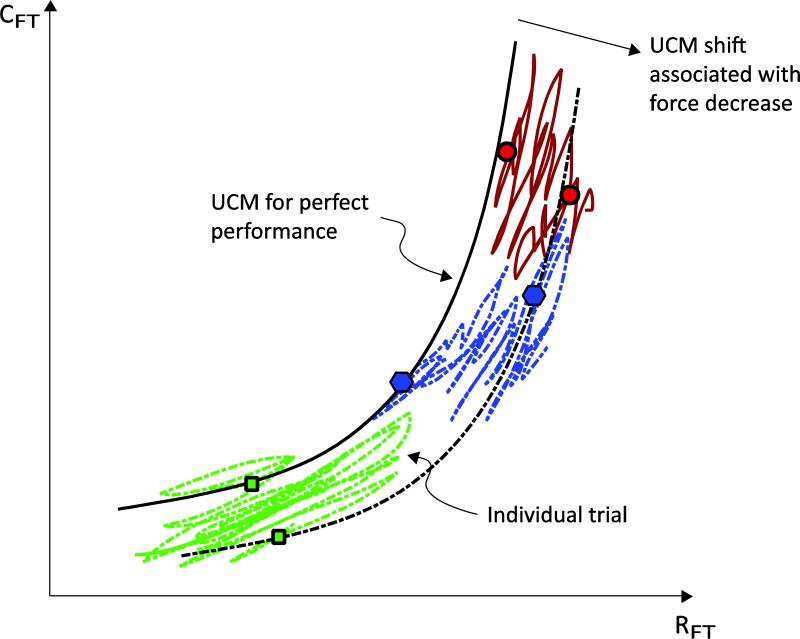
Fig. 11.
Interpretation of results. Hypothetical trajectories in the {RFT; CFT} space are plotted for different trials. Each trial begins from a different location, but always close to the hyperbola for perfect performance, since visual feedback is available. After feedback removal, the force drops, and the UCM shifts accordingly. The dotted curve represents the UCM at a later time. The individual trial trajectories show large, irregular motion along the shifting UCM, and smaller, consistent motion along the direction of force drop

