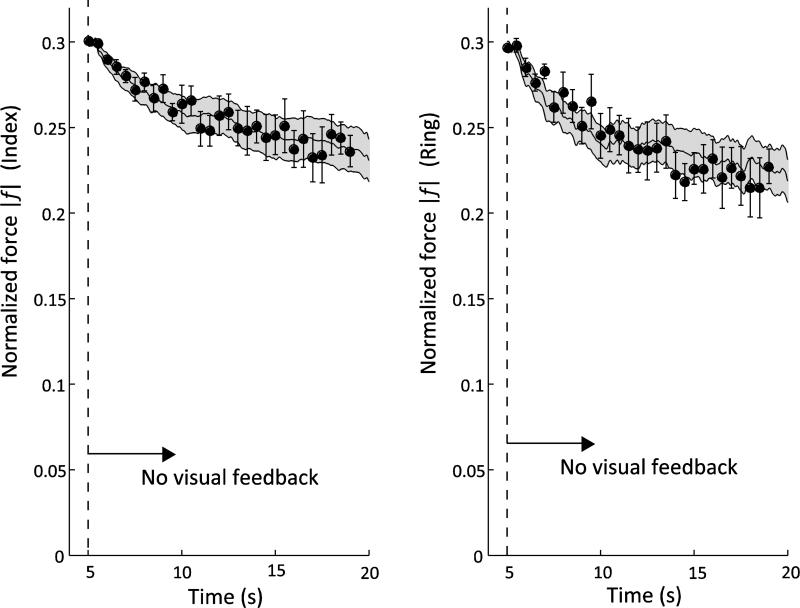
Fig. 4.
Force changes after feedback removal for Index and Ring fingers. The curve and band are the across-subject mean ± SE of the control trials. The solid points with the error bars are the across-subject means ± SE of the forces just before the perturbation was introduced. The force drop in the control trials is exponential for both fingers (Time constant, τ = 5.7 s and 3.4 s for index and ring fingers, respectively)

