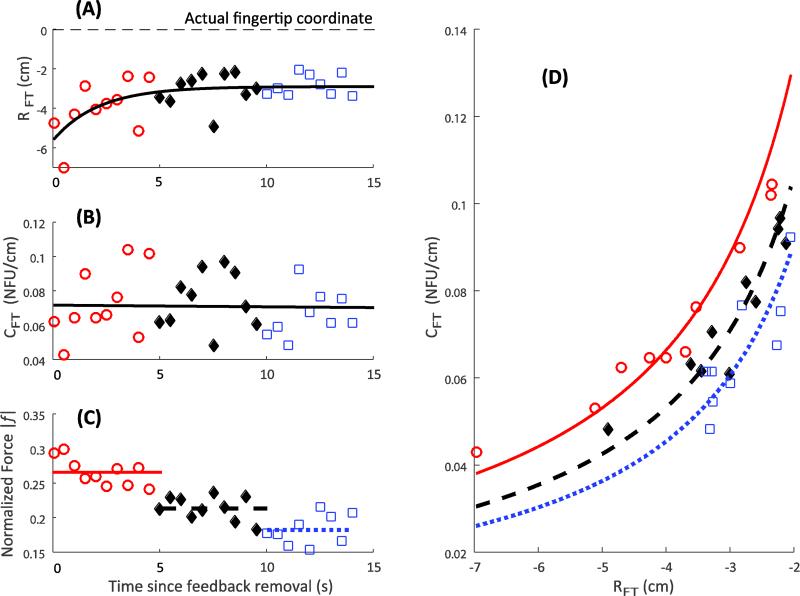
Fig. 6.
Individual subject response. Referent coordinate, R, reduces (Panel A), apparent stiffness, C, does not change (Panel B), and the finger force drops (Panel C) with time. The dashed line in Panel A shows the actual location of the fingertip. Panel D depicts the variability in the {R; C} space. Three hyperbolae correspond to the average force over three time bins, depicted in Panel C as dashed lines

