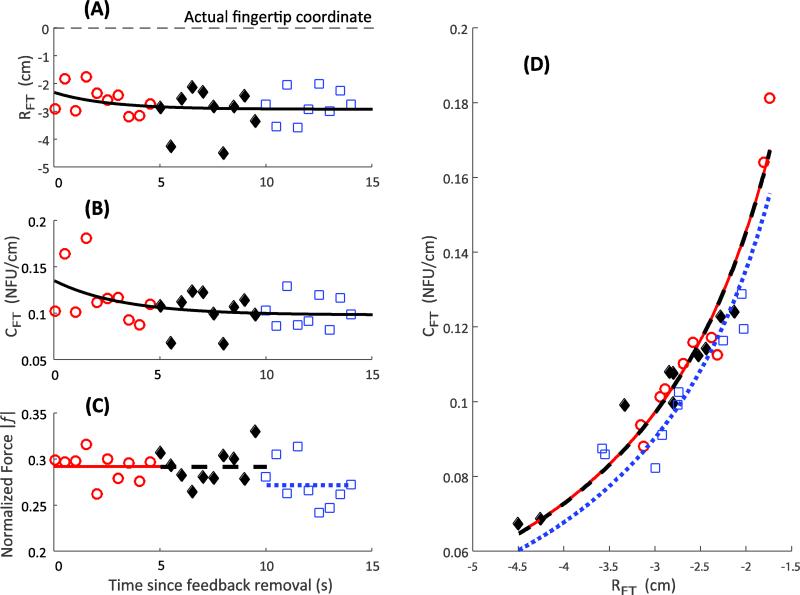
Fig. 7.
Individual subject response. The referent coordinate, R, (Panel A), apparent stiffness, C, decreases (Panel B), and the finger force drop (Panel C) with time. The dashed line in Panel A shows the actual location of the fingertip. Panel D depicts the variability in the {R; C} space. Three hyperbolae correspond to the average force over three time bins, depicted in Panel C as dashed lines

