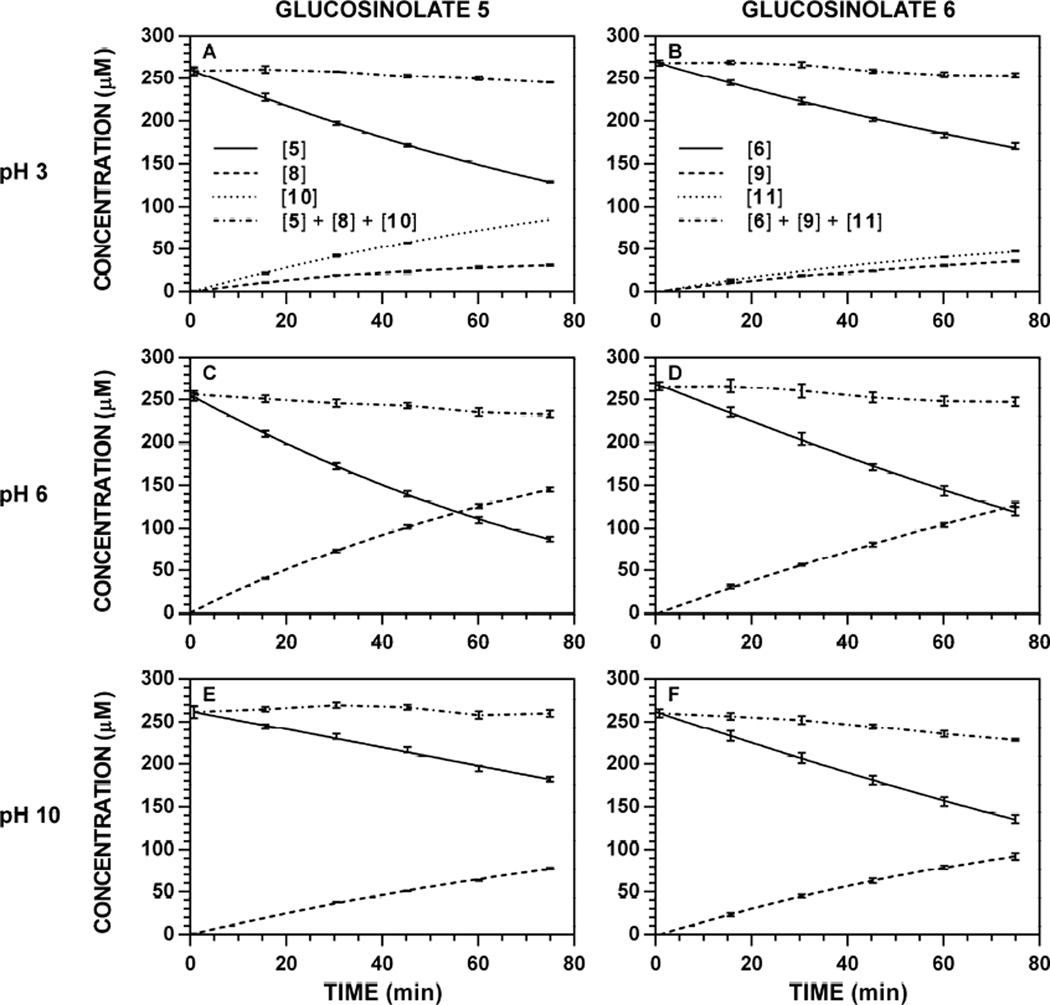
Figure 6.
Representative reaction progress curves for the hydrolysis of glucosinolates ([Gluc]0 250 µM) at variable pH and 37 °C. The concentration of myro sinase was constant for each substrate: 5, 8.83 U ml−1; 6, 1.77 U ml−1. HPLC chromatogram peak areas at specific wavelengths were used to determine [Gluc]t, [ITC]t, and [nitrile]t at each timepoint, and the data (n = 3) was fitted to a reaction progress curve using nonlinear regression: 5, 227 nm; 8, 227 nm; 10, 227 nm; 6, 227 nm; 9, 227 nm; 11, 210 nm. The dotted line denotes the sum of [Gluc] + [ITC] + [nitrile] at each timepoint, and its slope represents product loss over time. Reaction progress curves for all other pH-wavelength combinations are available [34]. A. Hydrolysis of 5, pH 3.0. B. Hydrolysis of 6, pH 3.0. C. Hydrolysis of 5, pH 6.0. D. Hydrolysis of 6, pH 6.0. E. Hydrolysis of 5, pH 10.0. F. Hydrolysis of 6, pH 10.0.

