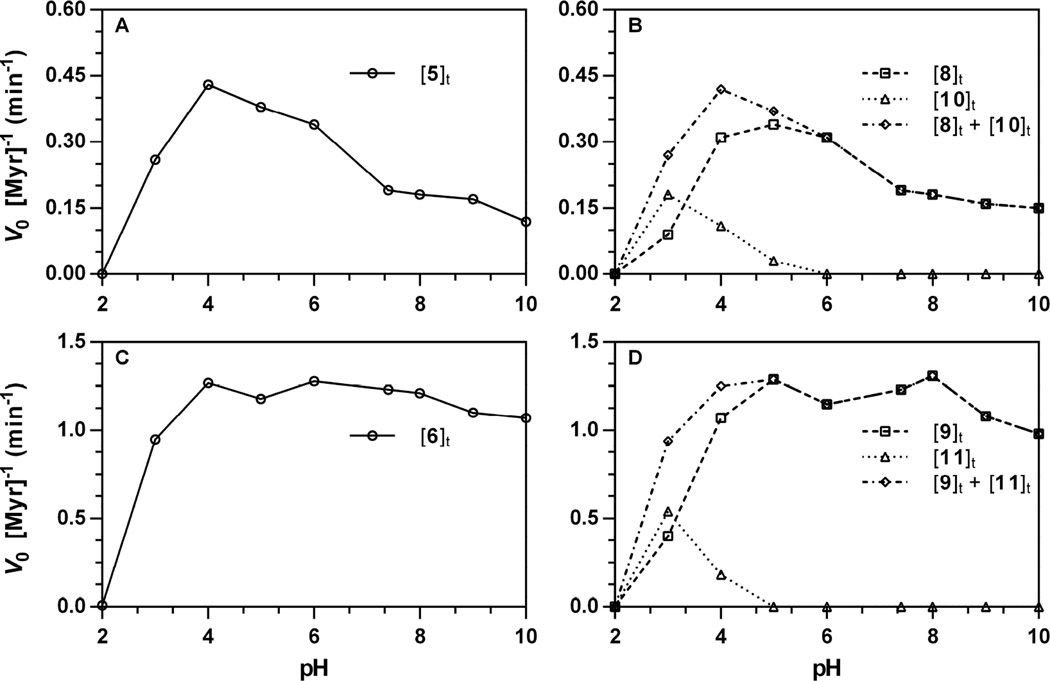
Figure 7.
pH Dependence of the action of Sinapis alba myrosinase on glucosinolates ([Gluc]0 = 250 µM, 37 °C). Rates of hydrolysis and product formation w ere independently obtained from progress curves tracking glucosinolate ([Gluc]t), isothiocyanate ([ITC]t), and nitrile ([nitrile]t) at a specific wavelength, then normalized for the concentration of myrosinase (V0 [Myr]−1, min−1): 5, 227 nm; 8, 227 nm; 10, 227 nm; 6, 227 nm; 9, 227 nm; 11, 210 nm. pH-Dependent rate constants for other wavelength-substrate combinations are available [34]. The sum of rate constants for product formation ([ITC]t + [nitrile]t) are included to demonstrate conservation of rates. A. Hydrolysis of 5 (227 nm). B. Formation of 8 (227 nm), 10 (227 nm), and sum. C. Hydrolysis of 6 (227 nm). D. Formation of 9 (227 nm), 11 (210 nm), and sum.

