Fig. 5.
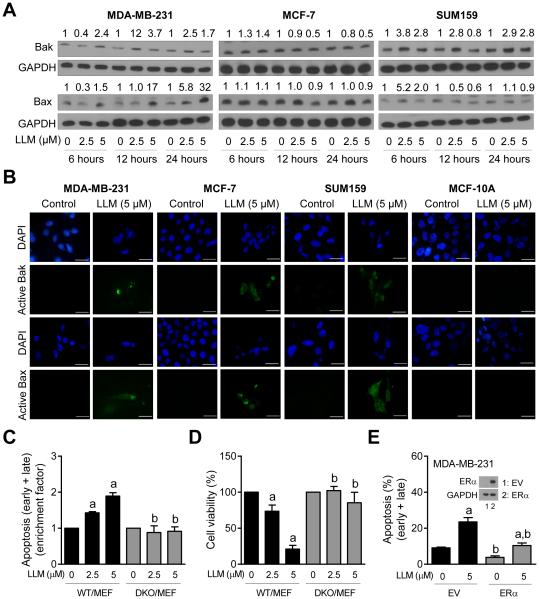
The role of Bak and Bax in LLM-induced apoptosis. A Immunoblotting for Bak and Bax using lysates from MDA-MB-231, MCF-7, and SUM159 cells after 6-, 12- or 24-hour treatment with ethanol (control) or the indicated doses of LLM. Numbers above band represent changes in protein levels relative to corresponding control. B Representative microscopic images (100× objective magnification; scale bar = 30 μm) depicting active-Bak and active-Bax in MDA-MB-231, MCF-7, SUM159, and MCF-10A cells after 24-hour treatment with ethanol (control) or 5 μM of LLM. C Quantitation of apoptotic cells (Annexin V-FITC/PI method) normalized to respective control in WT/MEF and DKO/MEF. The cells were treated for 24 hours with ethanol (control) or the indicated concentrations of LLM and processed for flow cytometry. D Percentage of cell viability relative to respective control in WT/MEF and DKO/MEF cells (24-hour treatment). Results shown are mean ± SD (n = 3). Statistically significant (P < 0.05) compared with a respective control and b between WT/MEF and DKO/MEF by one-way ANOVA followed by Newman-Keuls multiple comparisons test. E Percentage of apoptotic fraction (Annexin V-FITC/PI method) in MDA-MB-231 cells stably transfected with empty vector (EV) or ERα plasmid. The inset shows western blot for ERα. The cells were treated for 24 hours with ethanol (control) or 5 μM of LLM and processed for flow cytometry. Results shown are mean ± SD (n = 3). Statistically significant (P < 0.05) compared with a respective control and b between EV and ERα overexpressing cells by one-way ANOVA followed by Newman-Keuls multiple comparisons test. Each experiment was done at least twice and representative data from one such experiment are shown.

