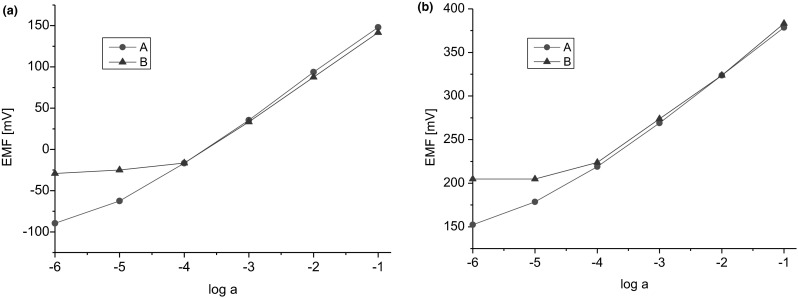
Fig. 10.

Response curves for Na+ obtained with ISEs based on ionophore 2. a graphite screen printed electrode (s-p,n). b glassy carbon electrode (gc). Curve A indicates the response for Na+ without interfering ions. Curve B indicates the response for Na+ with interfering ions (4.2 mM K+, 1.1 mM Ca2+, 0.6 mM Mg2+)
