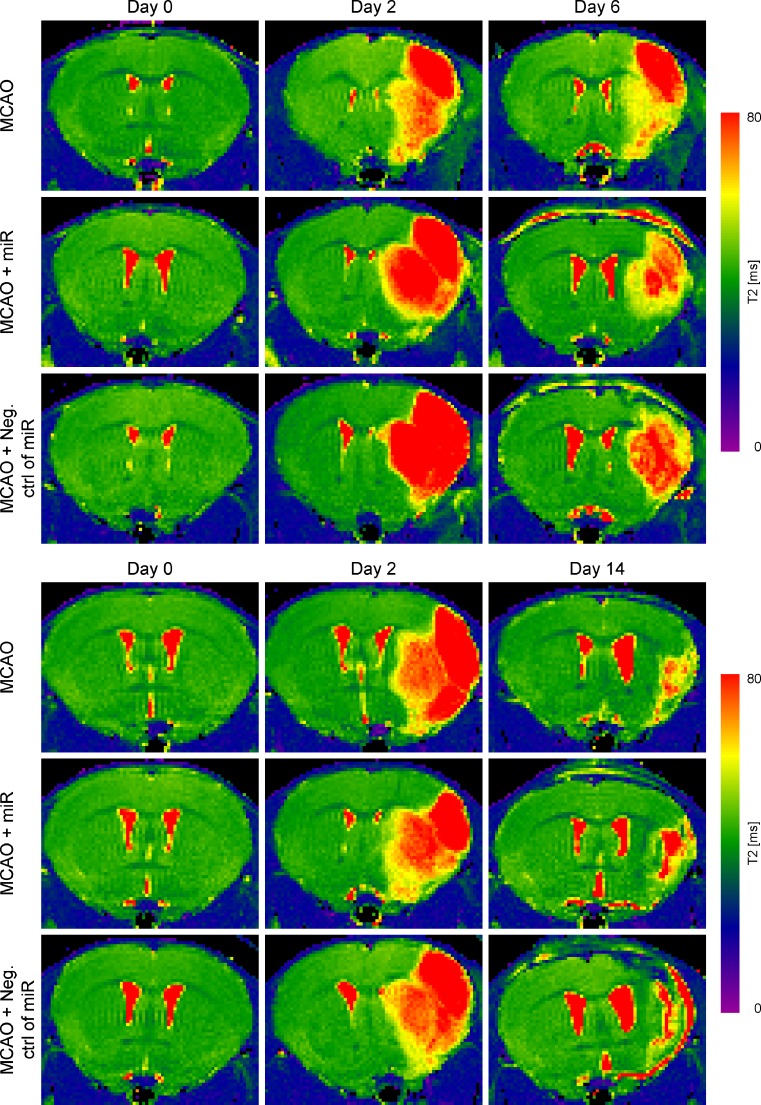
Fig. 1.
Characterization of ischemic lesion after ischemia. Representative T2map of three experimental groups subjected to MCAO and perfused at day 6 or day 14, respectively. T2 maps are shown as coronal brain section. T2 map of intact subjects, 1 week before MCAO, shows equal intensity of both hemispheres. 48 h after MCAO the cortico-striatal lesions are visible in the right hemisphere in T2-weighted images. A gradual shrinkage of infarct volume was visible at days 6 and 14 compared to day 2, showing the continuous reduction in vasogenic edema after stroke

