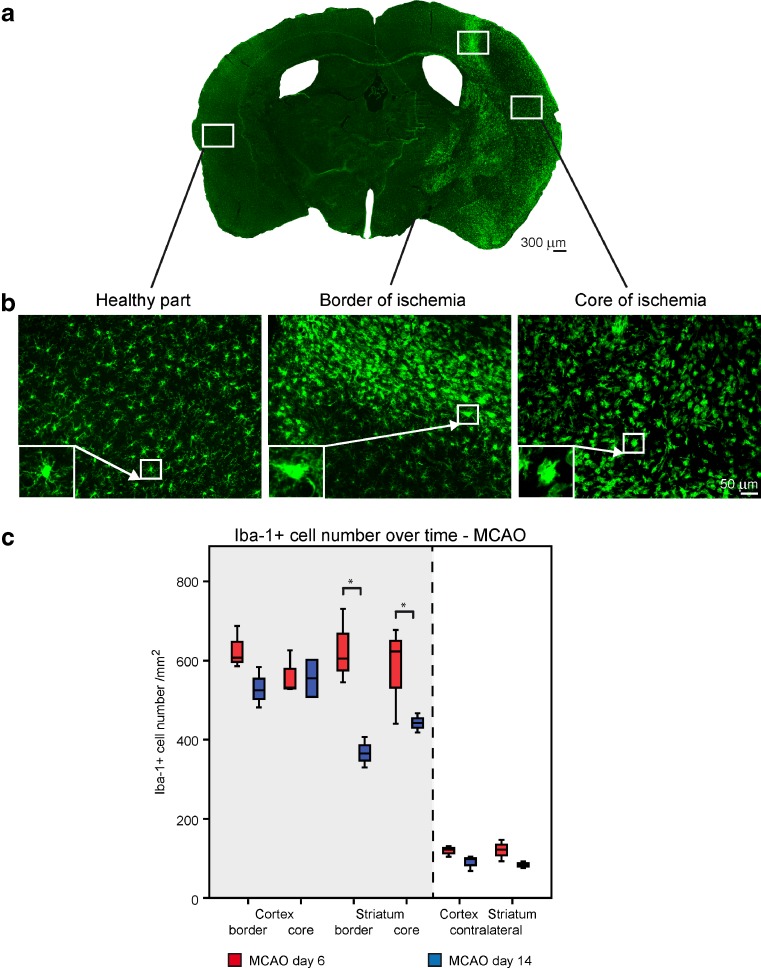
Fig. 2.
Different morphology and kinetics of microglial/macrophage after stroke. The photomicrographs show the localization of Iba-1 positive cells intensely at the ipsilateral ischemic hemisphere at day 6 after stroke in 4× magnification (a), and the different morphology of microglial/macrophage cells classified into ramified, intermediate, amoeboid or round phenotype in 20× magnification (b). Representative graph shows the number of Iba-1 positive cells in the core and border zone of cortex and striatum at day 6 in comparison to day 14 after stroke (c). A significant increase in Iba-1 cell number was detected at day 6 after the onset of stroke. n = 5 mice for each time point. Median and minimum/maximum values are shown; *P < 0.05 at independent one-tailed Student’s t-test. Scale bar 50 μm

