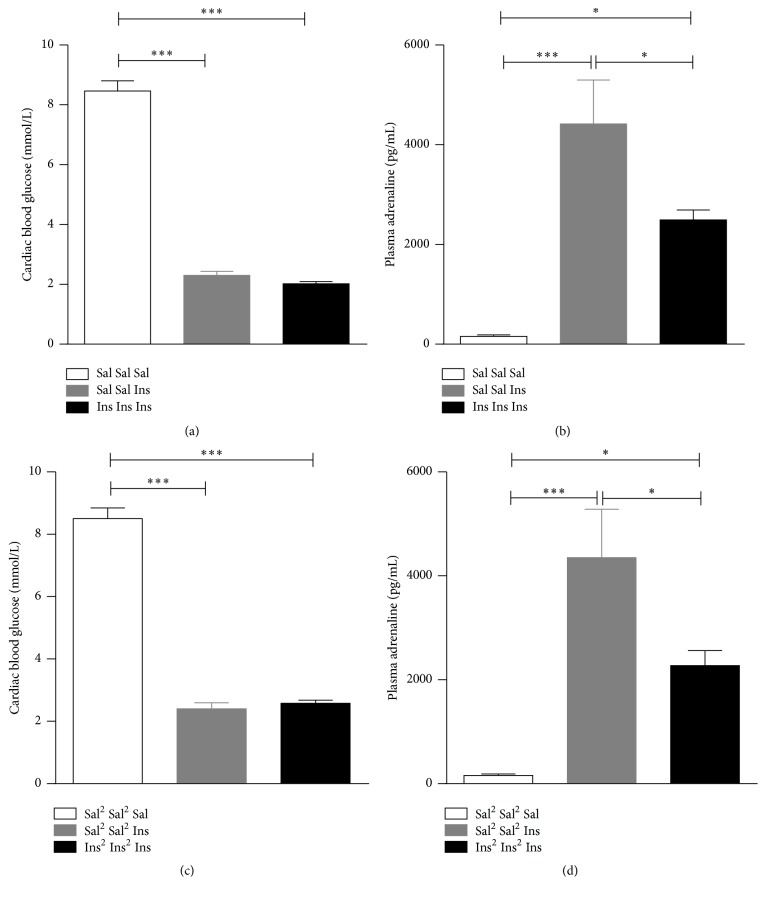
Figure 3.
Cardiac blood glucose (a, c) and plasma adrenaline (b, d) levels in rats exposed to saline (white bars), single hypoglycaemia (grey bars), or recurrent hypoglycaemia (black bars). In the recurrent hypoglycaemia groups, rats were exposed to one (a, b) or two episodes (c, d) of antecedent hypoglycaemia per day for two consecutive days followed by an additional episode of hypoglycaemia on day 3. Sal or Sal2: saline given once or twice a day, respectively; Ins or Ins2: insulin given once or twice a day, respectively. Data are presented as mean ± SEM. ∗ p < 0.05; ∗∗∗ p < 0.001.

