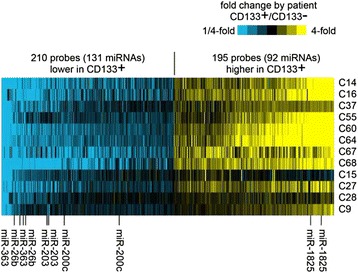
Fig. 1.

Heat-map representation of top differentially expressed miRNAs (p < 0.01, paired t-test, fold change > 1.4) in CD133+ larynx CSLCs vs. CD133− larynx tumor cells, across twelve different patients. Yellow, high fold change in CD133+ patient sample as compared to its corresponding CD133− paired sample; blue, high fold change in CD133− sample compared to CD133+ paired sample
