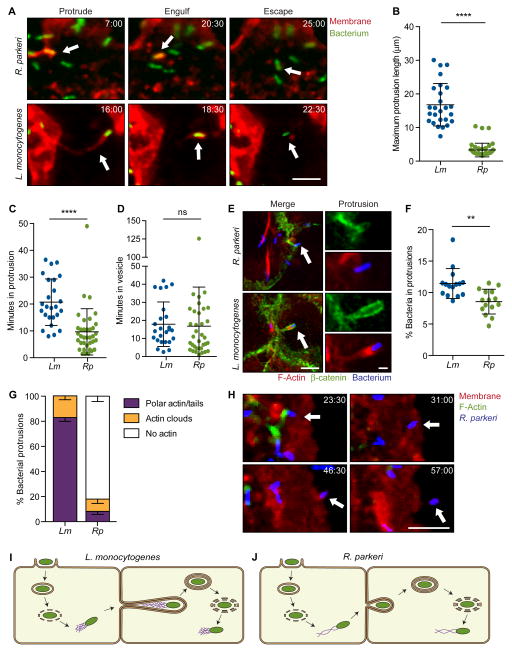
Figure 1. R. parkeri exhibit a morphologically distinct method of cell-to-cell spread.
(A) Live cell imaging snapshots of the three steps of spread for R. parkeri or L. monocytogenes (Red, TRTF; green, bacterium). (B–D) Quantification of spread parameters from live cell imaging showing (B) maximum protrusion length, (C) time spent in protrusion before engulfment and (D) time spent in vesicle before escape to cytosol. (E) Images of cells infected with Rp-2xTagBFP or Lm-TagBFP. Host membrane stained with anti-β-catenin (green) and F-actin stained with phalloidin (red). Arrow indicates protrusions shown at right. Scale bar for merge image, 5 μm; protrusion image, 1 μm. (F) Percentage of bacteria in protrusions. (G) Percentage of bacterial protrusions with different F-actin phenotypes. Mean ± SEM. (H) Live cell imaging snapshots of Rp-2xTagBFP spread. Arrow indicates a bacterium spreading into unlabeled recipient cell. (Red, TRTF; green, Lifeact-mWasabi; blue, bacterium). (I, J) Infectious life cycles of (I) L. monocytogenes and (J) R. parkeri illustrating differences in the presence or absence of actin tails in protrusions and the organization of actin filaments in tails (actin tail, purple; bacterium, green). For (A) and (H), time shown as min:sec and scale bar, 5 μm. Data from (B–D) and (F) are mean ± SD, unpaired T-test: ** p < 0.01, *** p < 0.001. Rp, R. parkeri; Lm, L. monocytogenes. See Movies S1–S3.

