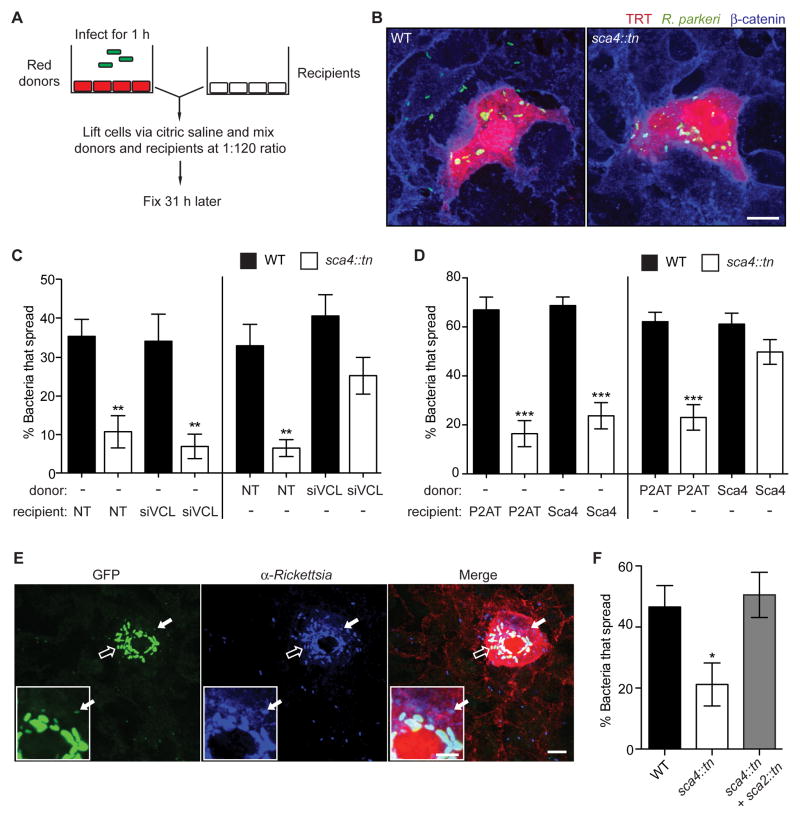
Figure 5. Sca4 acts in trans to target vinculin in the donor cell.
(A) Mixed cell assay schematic, as described in methods. (B) Images of infectious foci detected in the mixed cell assay showing A549-TRT (soluble TagRFP-T, red), R. parkeri (green) and β-catenin (blue). Scale bar, 10 μm. (C) Mixed cell assay results showing percentage of bacteria that spread to recipient cells in a focus. Donor or recipient cells were reverse transfected with control siRNA (NT) or siVCL #1 and infected with WT (Rp-GFP) or sca4::tn. Mean ± SEM, one-way ANOVA: ** p < 0.01 relative to WT + NT in each set. (D) Mixed cell assay results as in (C) except indicated donors or recipients were transduced with FCW2-P2AT (control) or FCW2-P2AT-Ires-Sca4 (Sca4). One-way ANOVA: *** p < 0.001 relative to WT + P2AT in each set. (E and F) Mixed cell assay as in (A, B) except the donor cell was infected with WT (Rp-GFP), sca4::tn or a mixture of sca4::tn and sca2::tn. (E) Image of an infectious focus co-infected with sca2::tn (bright green, open arrow) and sca4::tn (dim green, solid arrow) and counterstained for Rickettsia (blue) and β-catenin (red). Scale bar, 10 μm. Inset, expanded view of donor cell region indicated by solid arrow (inset scale bar, 5 μm). (F) Percentage of bacteria that spread for WT (Rp-GFP), sca4::tn, or sca4::tn in the presence of sca2::tn. No spread was detected for sca2::tn. Mean ± SEM, one-way ANOVA: * p < 0.05 relative to WT. See Figure S2.

