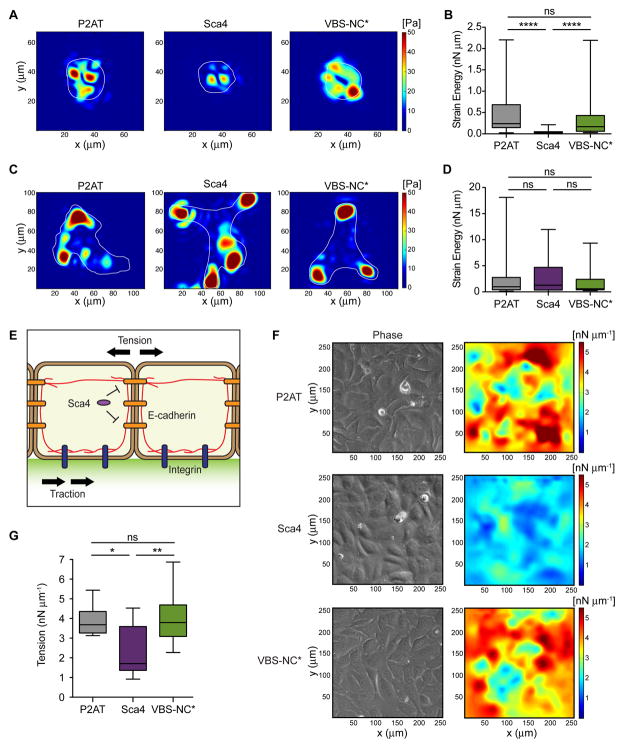
Figure 7. Sca4 modulates E-cadherin forces in a vinculin-dependent manner.
TFM results for individual cells adherent to polyacrylamide gels coated with E-cadherin-Fc (A, B) or collagen I (C, D). (A, C) Instantaneous maps showing the magnitude of traction stresses (color indicates stress values in Pa). Cell outlines in white. (B, D) Time-averaged strain energy (nN μm) from individual cells. (E) Model depicting how biomechanical crosstalk allows measurements of traction stresses at cell-ECM junctions to be converted to tension. Cells adhere to a gel containing green fluorescent beads in upper layer. Actin cables (red) connect E-cadherin (orange) and integrin (blue) adhesions. Sca4 specifically targets cell-cell junctions. (F) MSM results for cell monolayers adherent to gels coated with collagen I. Images show the distribution of tension (right) and cells as seen by phase contrast (left). (G) Time-averaged monolayer tension (nN μm−1) calculated for multiple regions within the monolayer. Mann-Whitney rank sum T-test: * p < 0.05, ** p < 0.01, **** p < 0.0001. See Figure S2.

