Figure 1.
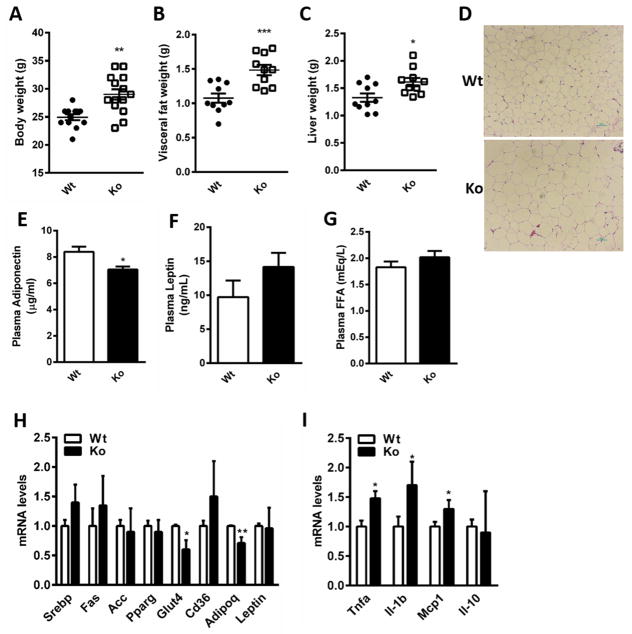
Metabolic characterization of Nat1 deficient mice (A) Body weight (B) Epididymal fat and (C) Liver weights of wild-type (Wt) and Nat1 deficient mice (Ko) at 16 weeks fed a chow diet (n=10–15 mice per group). Values are mean ± SEM. (D) Haematoxylin and eosin staining (H&E) of epididymal WAT of wild type and Nat1 deficient mice. Scale bar, 100×Pi (10X magnification). (E) Plasma adiponectin (F) Leptin (G) FFA concentrations were determined in mice fasted overnight (n=10–13 per genotype). Values represent means ± SEM. (***p ≤ 0.001, **p ≤ 0.01, *p < 0.05). Gene expression profiling in white adipose tissue in wild type and Nat1 Ko mice (n = 5–6 mice per group) using real-time quantitative PCR for expression of genes involved in lipid metabolism (H) and for inflammatory markers (I). The expression values were normalized to cyclophilin. Results represent mean ± SEM (**p ≤ 0.01, *p < 0.05).

