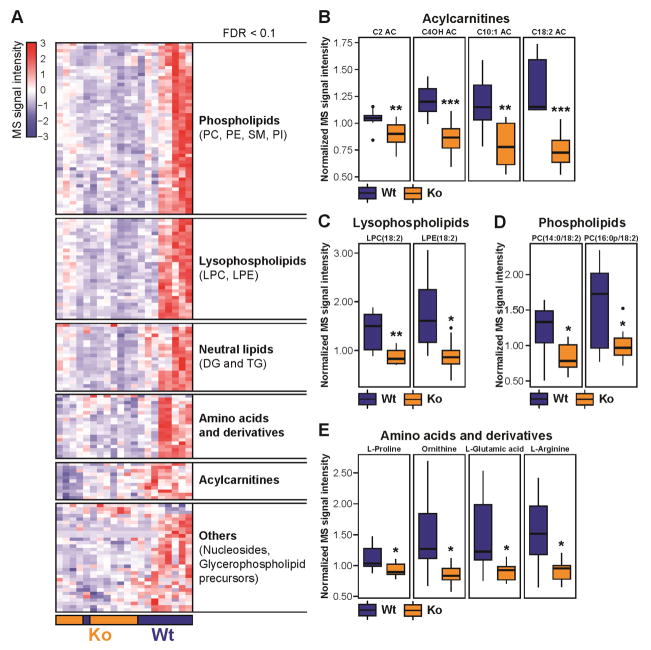
Figure 2.
Effect of Nat1 deficiency on fasting plasma metabolome and lipidome. (A) Hierarchical clustering of significantly different metabolites and lipids in fasting plasma from non-targeted metabolomics and lipidomics experiments (FDR < 0.1). Signal intensities were clustered in two dimensions (horizontal: metabolites and lipids; vertical: samples) on the basis of Euclidean distance. Colors indicate metabolite/lipid abundance as high (red), median (white), or low (blue). (B, C, D, E) Values are normalized to the median and expressed as box-and-whisker plots; n = 9–11; *p ≤ 0.05, **p ≤ 0.01, ***p ≤ 0.001. AC: acylcarnitine, DG: diacylglycerol, PC: phosphatidylcholine, PE: phosphatidylethanolamine, PI: phosphatidylinositol, SM: sphingomyelin, TG: triacylglycerol. The list of significantly changing metabolites and lipids are shown in Supplemental Table 1. Data obtained from non-fasting plasma samples are shown in Supplemental Figure 2.

