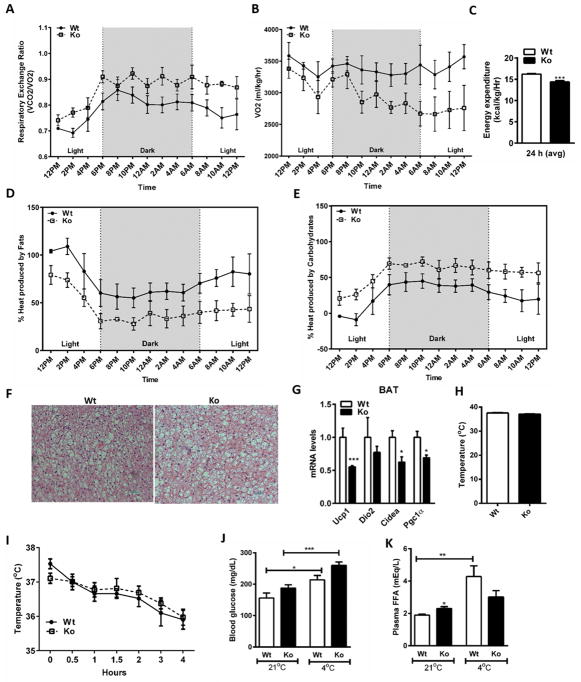
Figure 6.
Decreased metabolic rate in Nat1 Ko mice. (A) RER (B) VO2 (C) Energy expenditure was measured in 4 month-old wild-type and Nat1 deficient mice given a normal chow diet for 24 h (n = 4 mice per group) (***p ≤ 0.001). (D and E) Heat production was measured for 24 hours in 4 month-old wild-type and Nat1 deficient mice given a normal diet for 24 h (n = 4). (F) H&E staining of brown adipose tissue of wild type and Nat1 deficient mice (n = 4). (G) Thermogenic gene expression in BAT of wild type and Nat1 deficient mice. (n = 3), normalized to cyclophilin. Results represent mean ± SEM. (H) Core body temperature was measured in 4 month-old wild-type and Nat1 deficient male mice fed a chow diet (n=5–8 mice). (I) Rectal temperature was measured every 30 min for 4 h after exposure to a 4°C environment (n=5–8 mice). (J) Blood glucose (K) Non-esterified fatty acids in plasma measured in wild-type and Nat1 deficient mice (*p ≤ 0.05, **p ≤ 0.01, ***p ≤ 0.001).

