
Fig. 2.
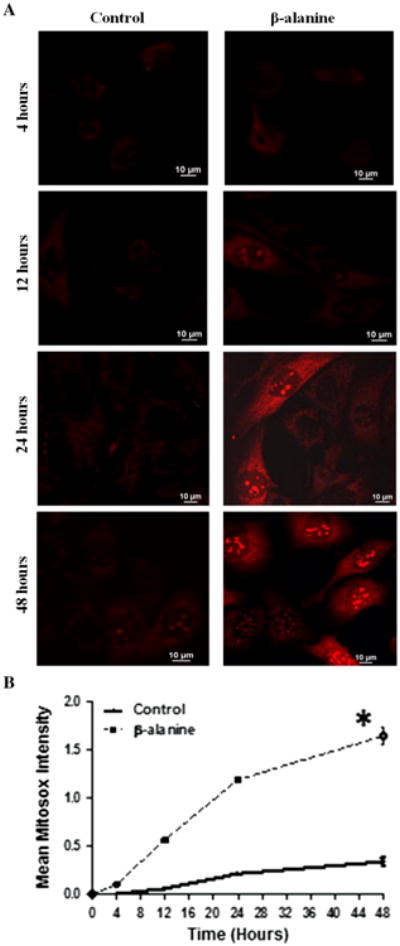
Time course of mitochondrial superoxide production by β-alanine-treated fibroblasts. a Representative images of MitoSox fluorescence (superoxide generation) in control and β-alanine-treated cells. While control cells exhibited a slow rate of superoxide generation, a significant elevation in mitochondrial superoxide levels was noted as early as 12 h of β-alanine exposure, an effect that became magnified with prolonged incubation. b The time course of superoxide generation in control and β-alanine-treated cells. The data represent means of 2 different preparations for 4, 12, and 24 h incubation periods, but mean ± S.E.M of 4 different preparations for the 48 h incubation period. The asterisk denotes a significant difference between β-alanine-treated and control cells (p < 0.05)