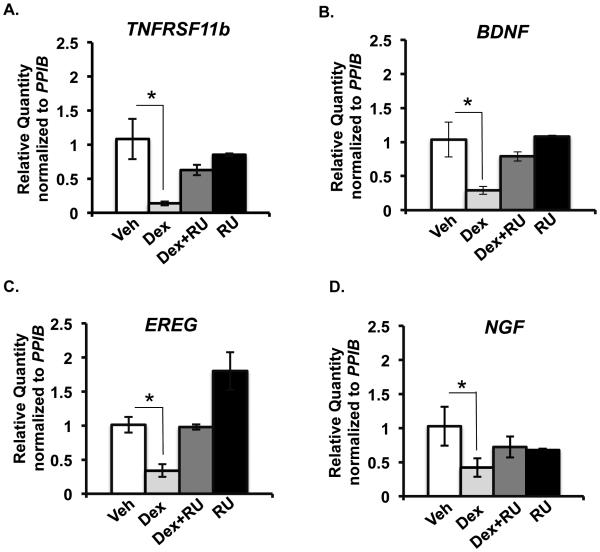
Figure 4.
Validation of microarray results by RT-PCR. TNFRSF11b, BDNF, EREG and NGF mRNA levels measured by RT-PCR and normalized to PPIB mRNA level in HCE cells treated with vehicle (white bars) or 100 nM dexamethasone (light grey bars) or a combination of 100nM dexamethasone and 1000nM RU486 (dark grey bars) or 1000nM RU486 (black bars). n = 3 or 4 biological replicates; *p<0.05.

