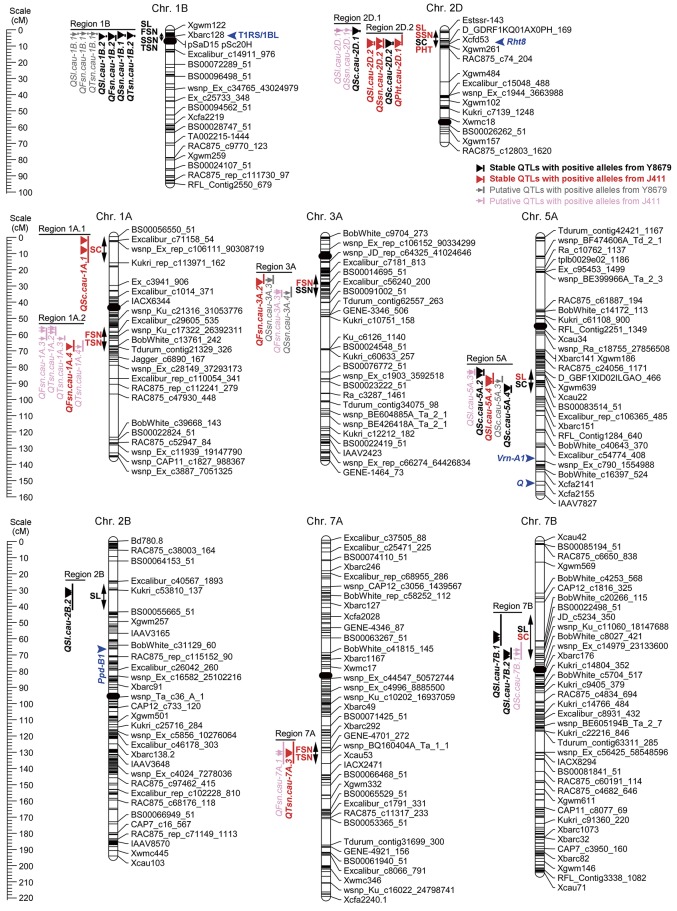
Figure 3.
Chromosomal locations of 10 genomic regions associated with spike morphological traits. Only environmentally stable QTLs and their tightly-linked putative QTLs are shown. A centiMorgan (cM) scale is shown on the left. Black ellipses represent the approximate locations of the centromeres. Vertical bars represent the LOD-2 confidence interval for the location of each QTL. Black and red triangles indicate environmentally stable QTLs with positive alleles from parent Y8679 and parent J411, respectively. Gray and pink arrows indicate putative QTLs with positive alleles from parent Y8679 and parent J411, respectively. Double headed arrows indicate the genomic regions characterized by QTLs or QTL clusters. Traits alongside the double headed arrows are spike length (SL), fertile spikelet number per spike (FSN), sterile spikelet number per spike (SSN), total spikelet number per spike (TSN), spikelet compactness (SC), and plant height (PHT). The known positions of the 1RS/1BL translocation (T1RS/1BL), Rht8, Ppd-B1, Vrn-A1, and Q loci are presented in blue arrows (Korzun et al., 1998; Liu et al., 2008; Cavanagh et al., 2013; Wang et al., 2014; Faris et al., 2014a).

