
FIGURE 4.
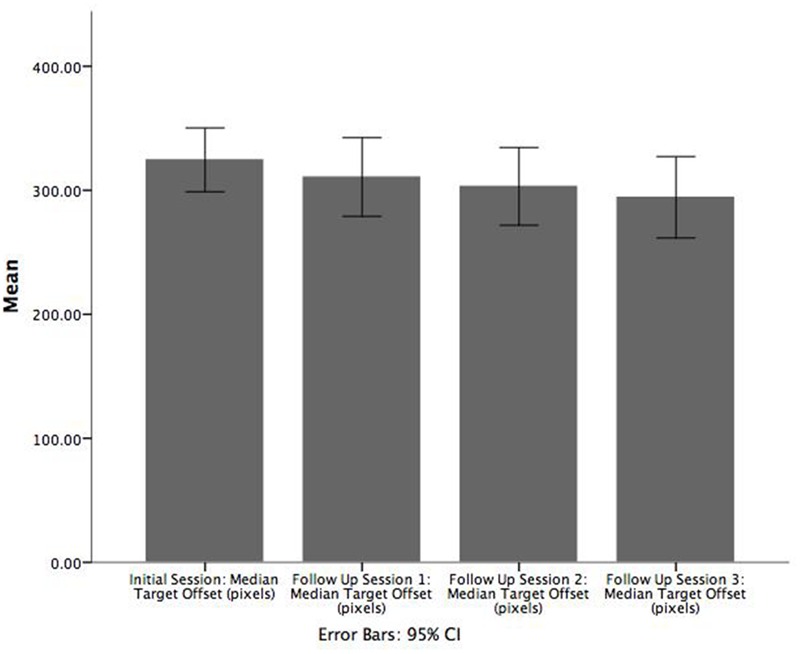
Bar chart illustrating the mean of median target offset (pixels) between initial enrolment compared to follow up session 1. Error bars are 95% CI.
Official websites use .gov
A
.gov website belongs to an official
government organization in the United States.
Secure .gov websites use HTTPS
A lock (
) or https:// means you've safely
connected to the .gov website. Share sensitive
information only on official, secure websites.
Bar chart illustrating the mean of median target offset (pixels) between initial enrolment compared to follow up session 1. Error bars are 95% CI.