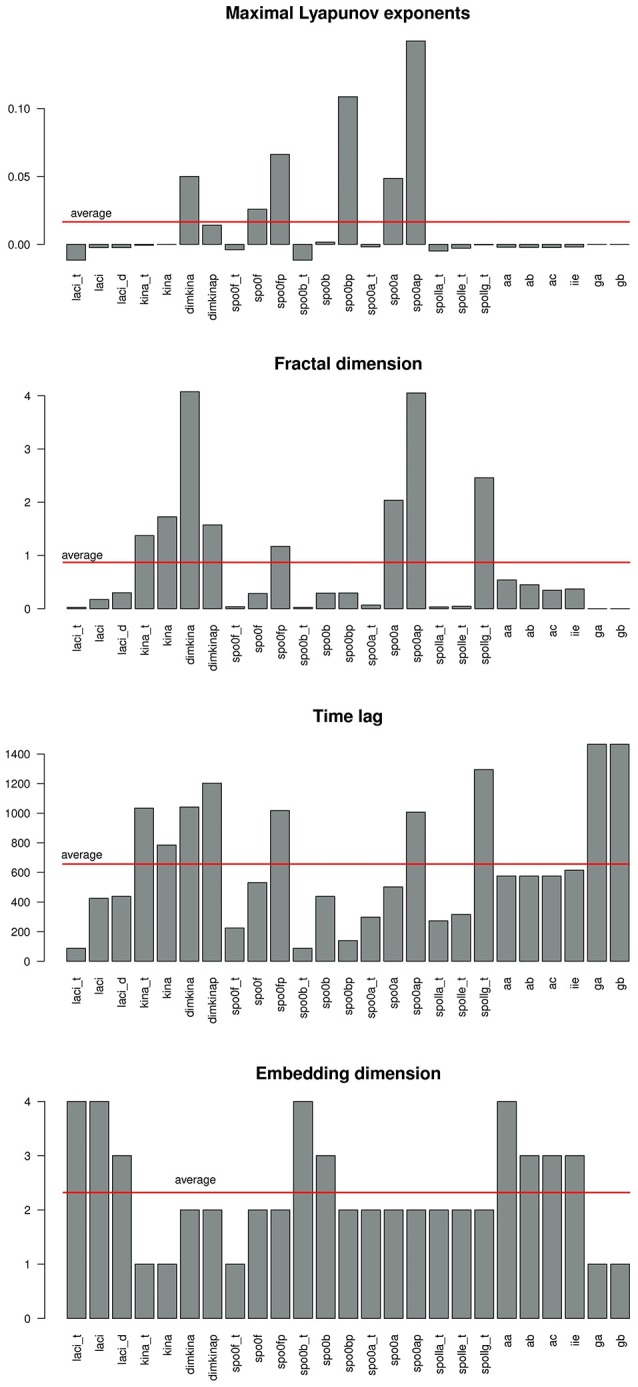
Figure 6.

Barplot showing the values of the complexity indices maximal Lyaopunov exponent (A), fractal dimension (B), time lag (C), and embedding dimension (D) estimated from the time series of each molecular species in the system. A red line marks the average value.
