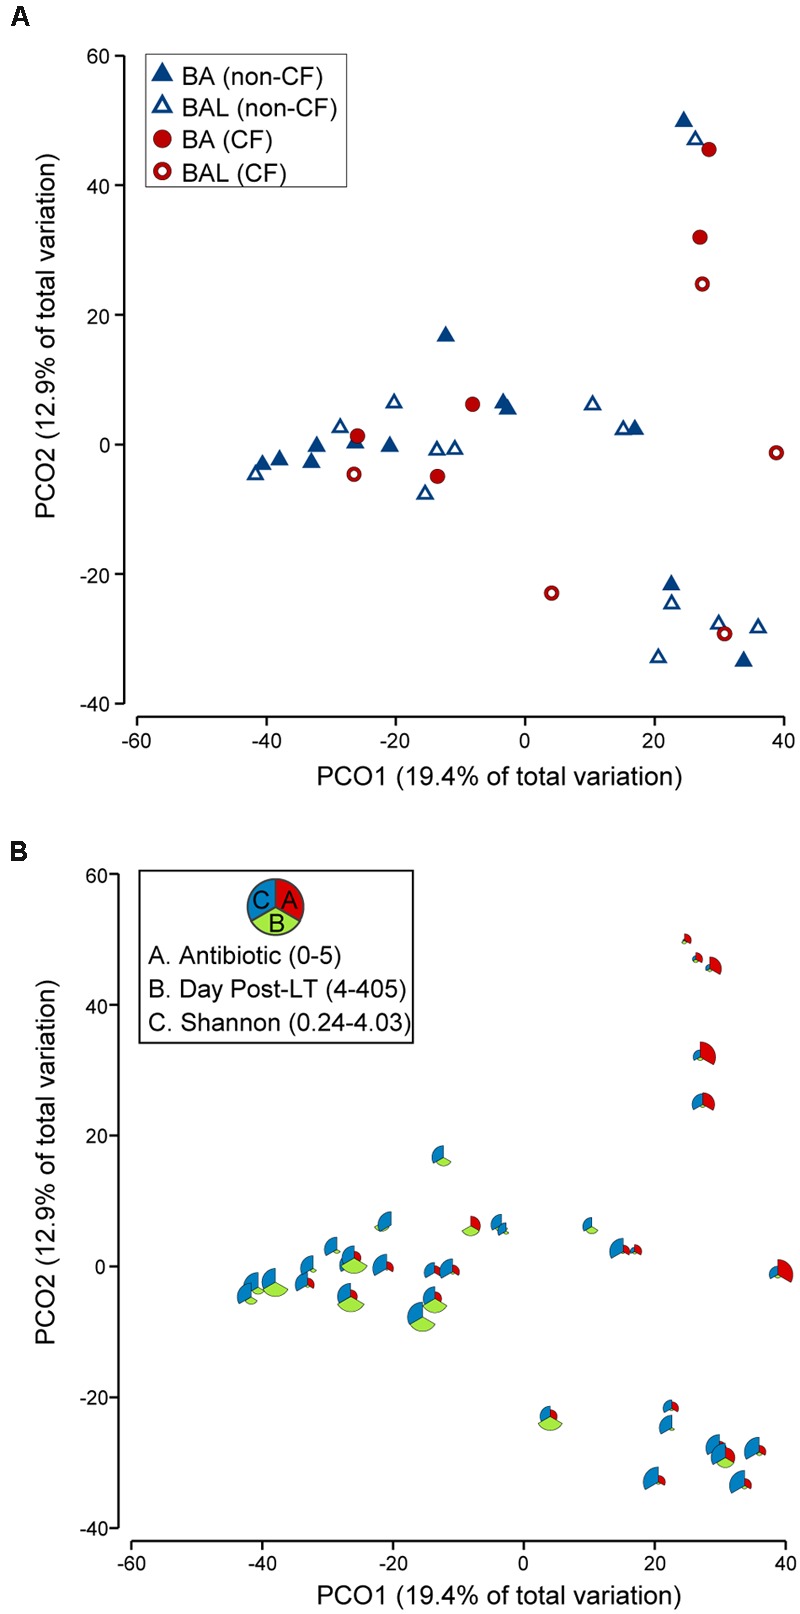
FIGURE 6.

PCoA of 18 pairs of BA–BAL samples. Only the first BA–BAL pair from each individual is presented (sampling range: days 4–405, median 24.5 days). The analysis was based on Bray–Curtis similarity matrix obtained on square-root transformed relative abundance of OTUs. (A) Symbols indicate the type of sample (BA, BAL) and CF pathology (CF, non-CF). (B) This bubble plot depicts the relationship between bacterial community profiles and the number of antibiotics used, day post-LT and Shannon diversity index. The larger the part of the pie is, the higher is the value (antibiotic: 0–5; day post-LT: 4–405; Shannon: 0.24–4.03).
