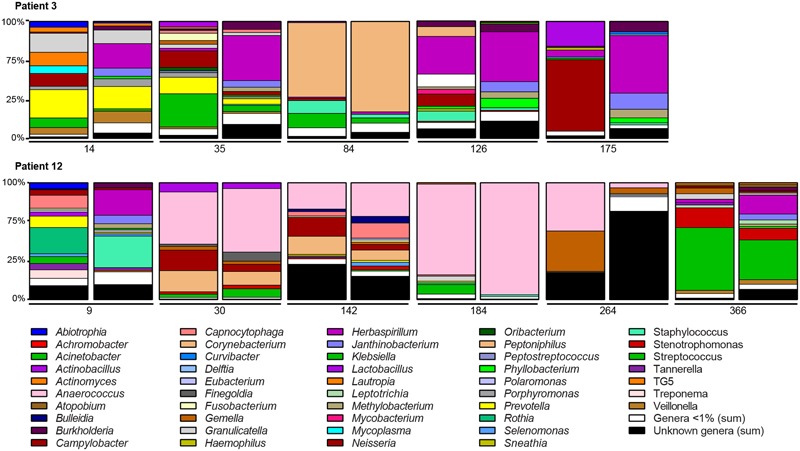
FIGURE 8.

Longitudinal analysis of the microbiota colonizing the conducting and respiratory zones of two non-CF patients. Bar graphs indicate the relative abundances of the genera identified by 16S rRNA gene sequencing. Bar graphs are presented by pairs: left, bacterial composition of BAs; right, bacterial composition of BALs. The number below the bar graphs indicates the time of sampling expressed in day post-LT. Only genera with relative abundance of >1% in at least one of the samples are presented. OTUs unassigned to a genus are pooled to represent the category “Unknown genera” while low-abundance genera (<1%) are pooled to represent the category “Genera <1%.”
