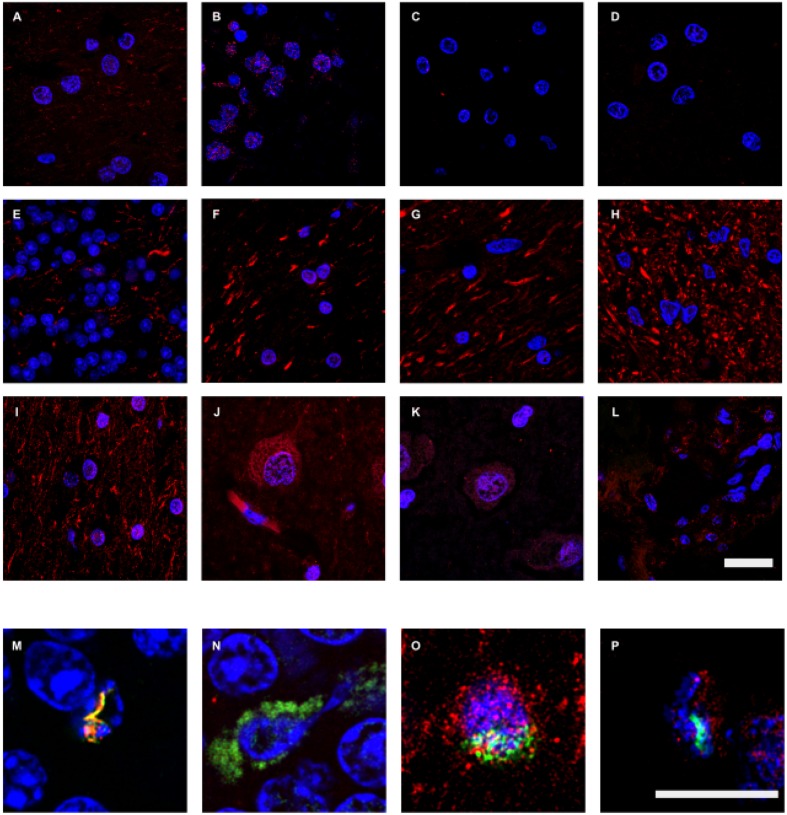
FIGURE 6.
Immunohistochemistry analysis of fungal enolase, β-tubulin, and chitin in brain sections from control subjects. CNS sections from six control subjects (C1–C6) were analyzed by confocal microscopy as detailed in the section of “MATERIALS AND METHODS.” Sections were immunostained with rabbit polyclonal antibodies against enolase, β-tubulin, and chitin (green) and human α-tubulin and neurofilaments (red), as described in Figures 1 and 2. (A–D,M): anti-enolase and anti-human α-tubulin antibodies. (E–H,N): fungal anti-β-tubulin and human anti-neurofilaments antibodies. (I–L,O–P): anti-chitin and anti-human α-tubulin antibodies. (A,I,O): C1. (B,E): C2. (C,F): C3. (D,N): C4. (G–H,J,M): C5. (K–L,P): C6. (A,G,I,J,O): LFC. (B,E,H,M,N): CEC. (C,D,F,K,P): ERH. (L): CP. DAPI staining appears in blue. The different panels are indicated in the figure. Scale bar: 20 μm for panels (A–L) and 10 μm for panels (M–P).

