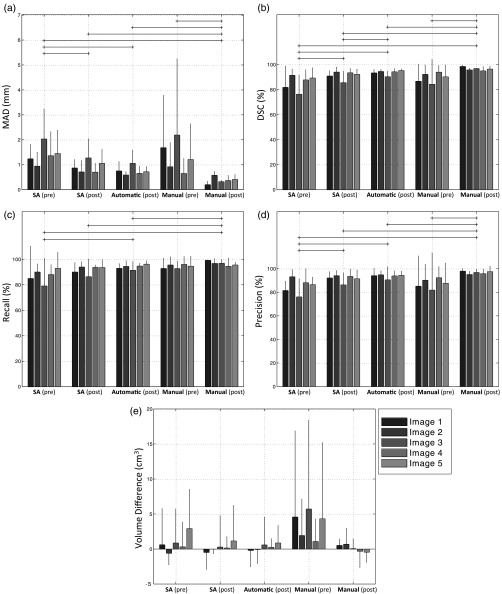
Fig. 5.
Interoperator variability based on (a) MAD, (b) DSC, (c) recall, (d) precision, and (e) volume difference. Each bar shows the average metric value for one image across five operators. The error bars indicate one standard deviation. The horizontal lines indicated statistically significant differences on the averages of the groups across all the five operators and five images (). SA, semiautomatic.

