
FIG 3.
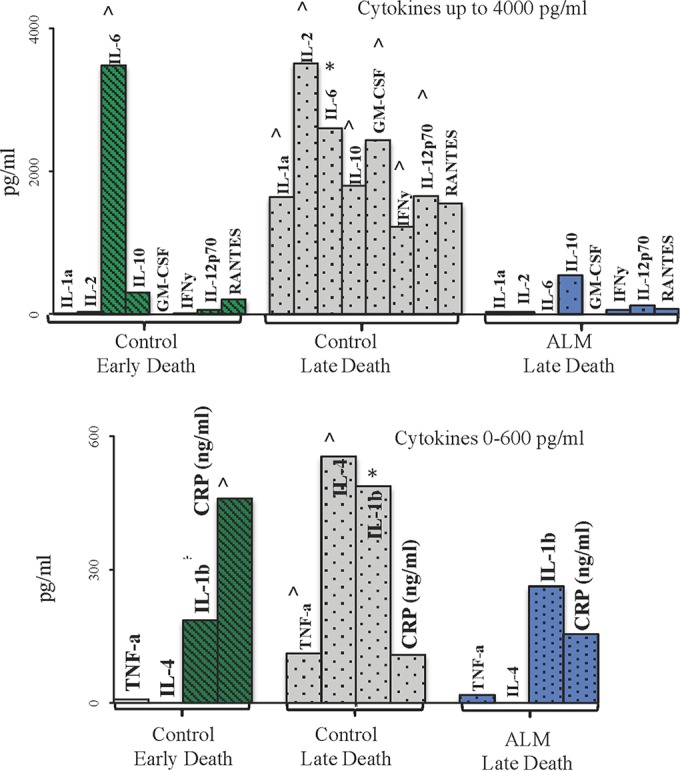
Plasma inflammatory cytokines in those animals that died. Data are presented as means ± SEM. *, P < 0.05 versus baseline group; ^, P < 0.05 versus all groups. Cytokines were grouped into high and lower activities for the three groups: controls with early death (n = 4) ( ); controls with late death (n = 2) (
 ); ALM-treated animals with late death (n = 1) (
 ).
).