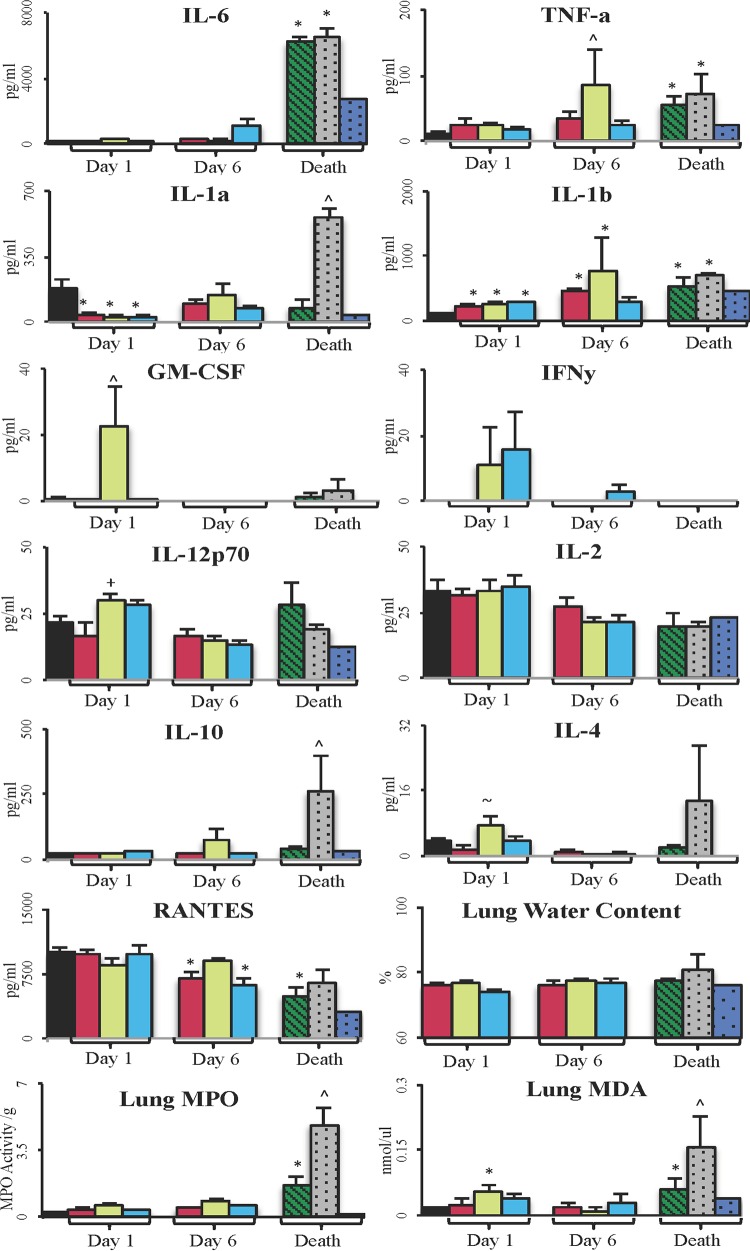
FIG 4.
Lung inflammatory cytokines and injury markers. ■, baseline (n = 8);  , sham (n = 8);
  , control survivors (n = 8, day 1; n = 2, day 6);
  , ALM survivors (n = 8, day 1; n = 7, day 6);
  , controls with early death (n = 4);
  , controls with late death (n = 2);
  , ALM-treated animals with late death (n = 1). Data are presented as means ± SEM. *, P < 0.05 versus baseline group; ^, P < 0.05 versus all groups; +, P < 0.05 versus sham and baseline groups; ∼, P < 0.05 versus sham group.

