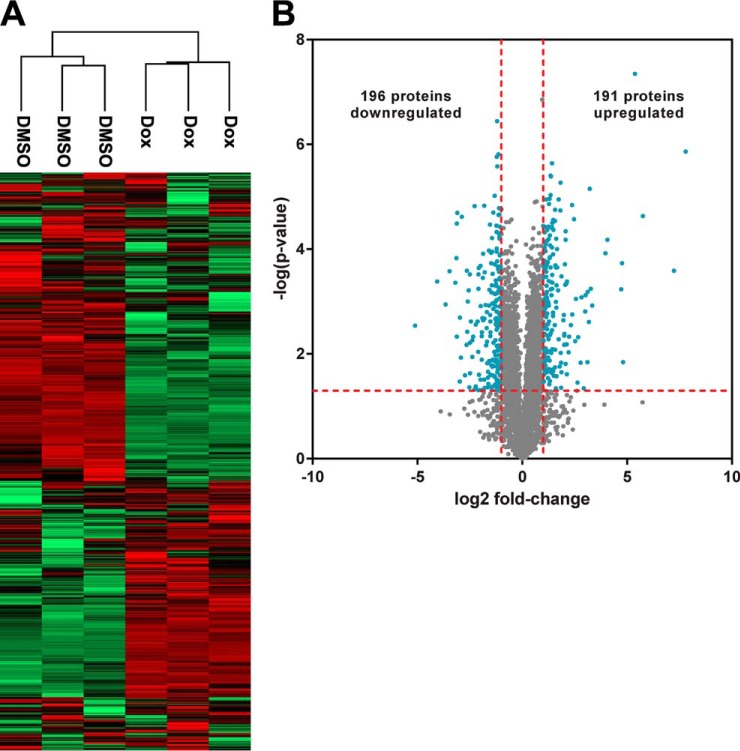
Fig. 3.
Characterization of the OVISE proteome with or without induction of wild-type ARID1A expression. A, Two-way, unsupervised hierarchical clustering of OVISE proteomes based on LFQ intensities. B, Volcano plot comparing proteomes from ARID1A-induced cells and control cells. Log ratios of LFQ intensities in ARID1A induction versus control were plotted against negative log p values from the Student's t test based on biological triplicates. Vertical lines: fold-changes of ± 2. Horizontal line: Student's t test p of 0.05. Blue points: proteins that meet both criteria for significant change between ARID1A induction and control (i.e. fold-change in abundance > 2 and p < 0.05). Gray points: proteins that do not meet both of these criteria.

