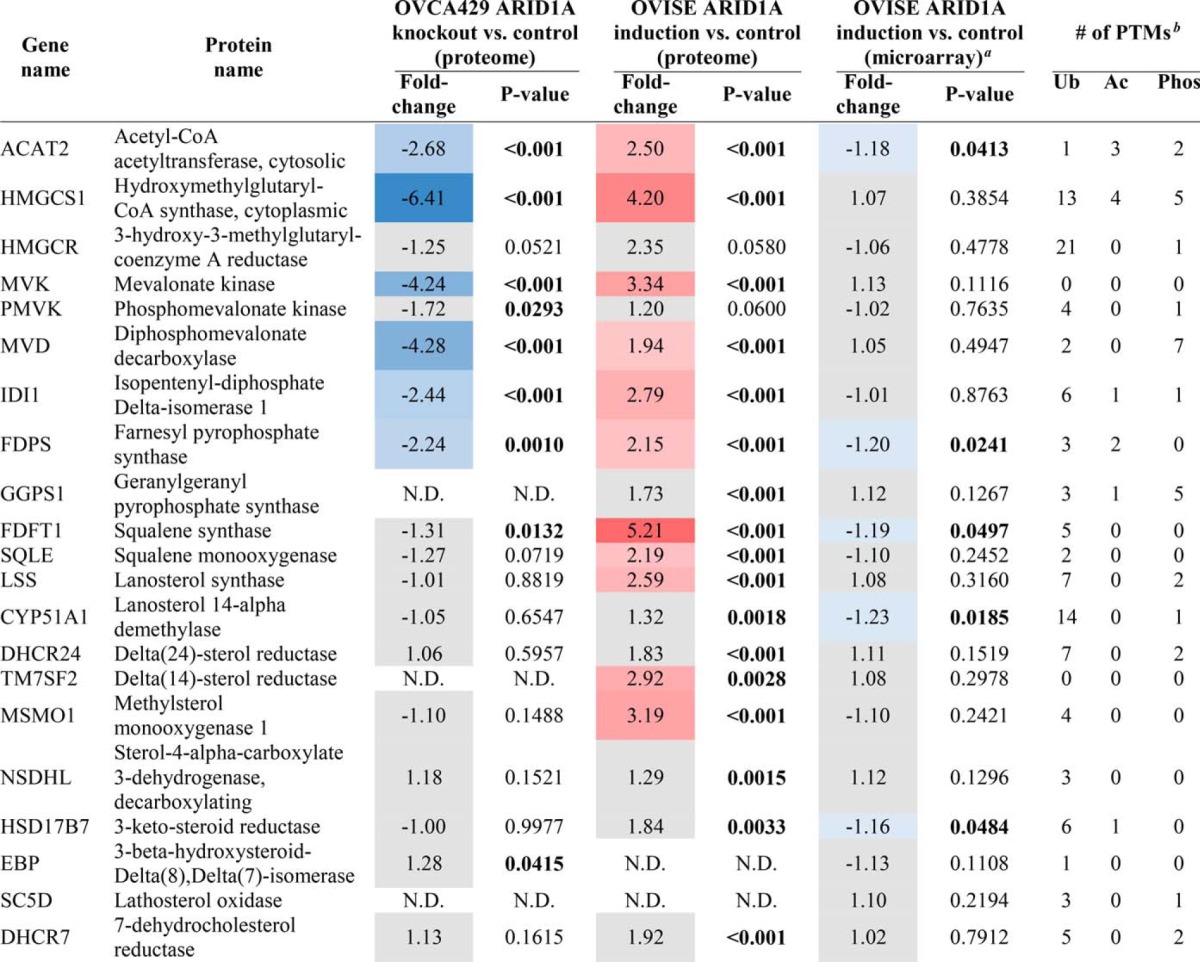
Table I. Mevalonate pathway enzymes in proteomics and microarray datasets.
Changes in abundance of enzymes that participate in mevalonate pathway and related downstream pathways. Inclusion in table based on IPA curation. Refer to supplemental Tables S3 and S6 for protein quantitation. For proteome analyses, significant changes were defined as fold-change > 2 and Student's t-test p < 0.05. For enzymes in the proteome analysis that significantly changed in one condition, a slightly relaxed fold-change was allowed in the other condition (i.e. fold-change of 1.8 with Student's t-test p < 0.05). For the microarray analysis, significant changes were defined as p < 0.05. Red and blue background: significantly higher or lower protein/gene level after ARID1A knockout/induction compared to control. Grey background: no significant change in level after ARID1A knockout/induction compared to control. N.D. indicates not detected in a given analysis. Significant p values (p < 0.05) are bolded.

