
Table II. Effects of wild-type ARID1A induction on protein and gene expression levels.
The 25 proteins showing the largest magnitude, significant changes in protein abundance after ARID1A induction in OVISE cell line. Proteins unable to be mapped to at least one Illumina microarray probe were pre-filtered from the list. Refer to supplemental Table S6 for protein quantitation. For the proteome analysis, significant changes were defined as fold-change > 2 and Student's t-test p < 0.05. For the microarray analysis, significant changes were defined as p < 0.05. Red and blue background: significantly higher or lower protein/gene level after ARID1A induction. Grey background: no significant change in level after ARID1A induction. N.D. indicates not detected in a given analysis. Significant p values (p < 0.05) are bolded.
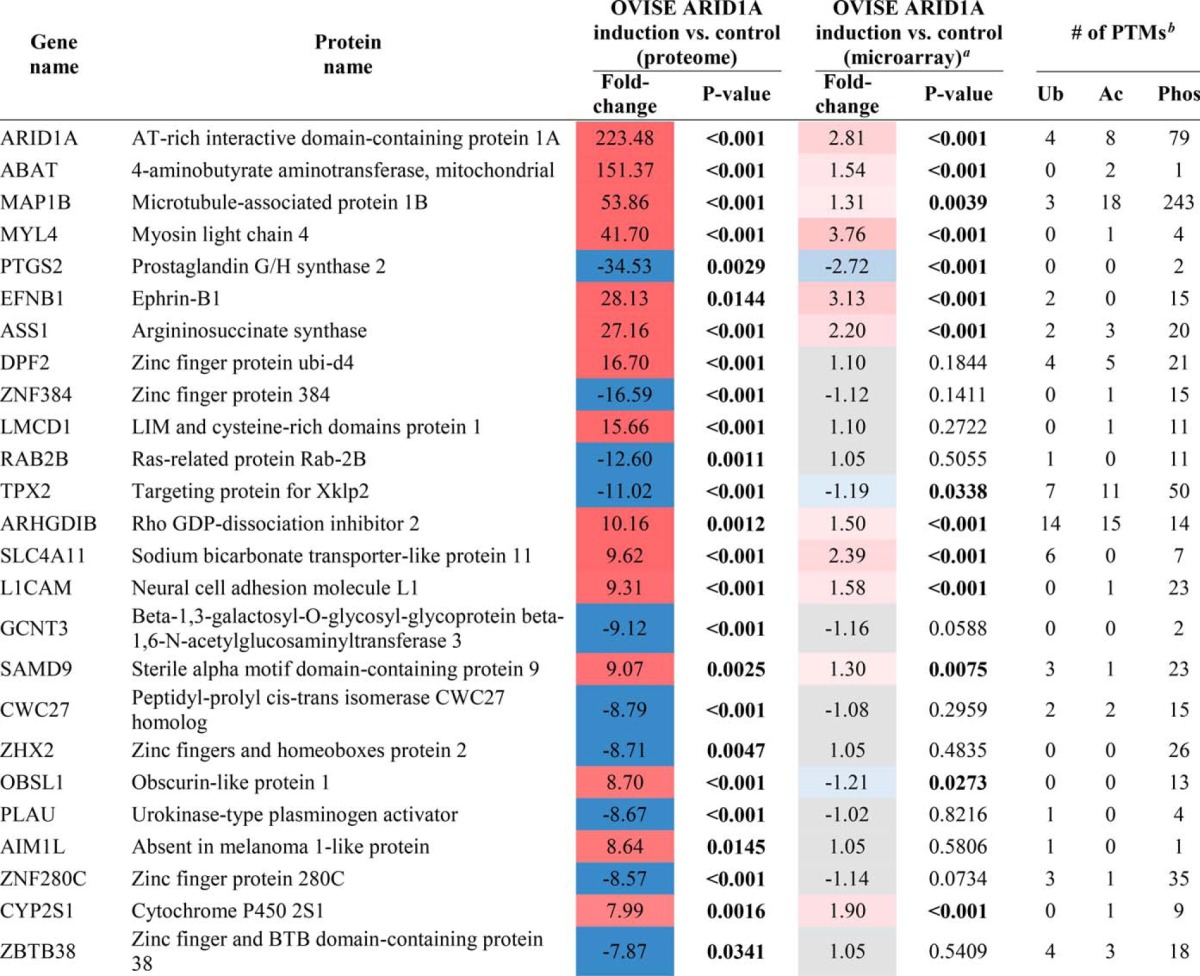
a Microarray data were obtained from the Gene Expression Omnibus database, accession number GSE5497 (20).
b Ubiquitination (Ub), acetylation (Ac), and phosphorylation (Phos) post-translational modifications (PTMs) curated by PhosphoSitePlus (http://www.phosphosite.org) (54). Only sites identified in human were considered.